This article was written by Kristy Blankers and Delma Kennedy.
Introduction
This summer, a benchmarking project was undertaken to determine how goats can be efficiently body condition scored and to collect industry information on typical body condition scores in different stages of lactation. In December 2023, a questionnaire was sent out through the Dairy Goat Digest to collect information on how body condition scoring is used in the industry and the need for additional resources on body condition scoring goats. The results of the survey and summer project are outlined below.
Survey Results
Thank you to those who took the time to complete the survey! There were 33 producers who responded to the survey. Of the respondents 51.5% were milking less than 200 goats, 27.3% were milking 201-400 goats, and 21.2% were milking 401-1000 goats. None of the respondents were milking over 1000 goats. The majority of the respondents (84.4%) thought that it would be beneficial to BCS their goats, with 72.7% of the respondents indicating that they knew how to BCS dairy goats. Of the respondents that indicated they knew how to BCS, 69% are actively using BCS as a management tool on their farm.
Producers that are actively using BCS as a management tool score their goats at various times in the production cycle, including: before breeding, drying off and kidding, and during early, mid, and late lactation. Figure 2 shows the number of producers scoring at various times in the cycle, please note the respondents were asked to select all that apply. Only 36.8% compare BCS of their goats throughout the production cycle.

Figure 1. Number of producers scoring at various stages of the production cycle.
There were a few producers that indicated interest in participating in our Dairy Goat BCS Benchmarking Study, a big thank you them!
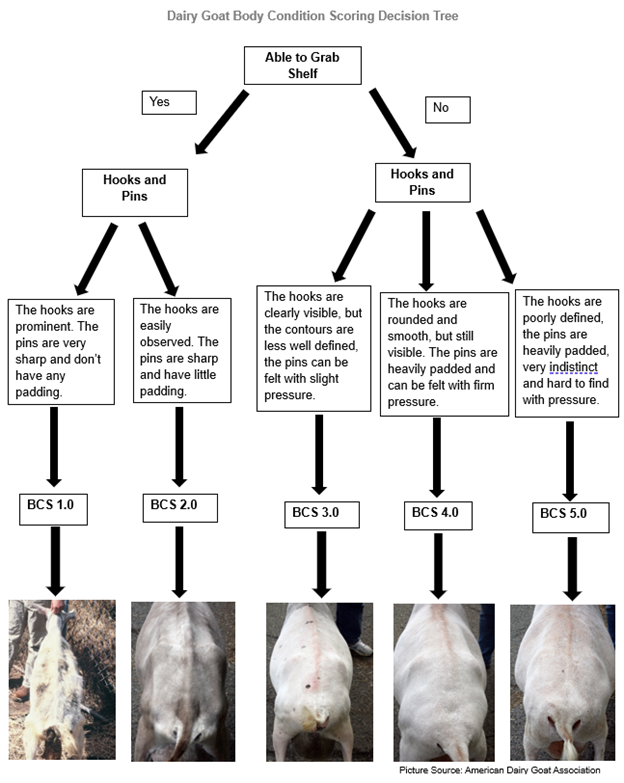
Development of a Scoring System
This summer when the Code of Practice scoring system was reviewed on farm, it became apparent that using all three sites (lumbar spine, ribs, and sternum) wouldn’t be practical to use on a large scale. Not all three sites are easily accessible in a handling chute, and only one of the sites is accessible in a parlour. Most dairy goat producers only have a parlour as a means of handling their goats, creating a need for a more streamlined system.
The BCS decision tree was developed by consulting the scoring systems from the Code of Practice, New Zealand Code, and the American Dairy Goat Association. The decision tree uses two sites on the goat: the lumbar spine (loin) and hooks and pins (pelvis bones), which are accessible from the hind end of the goat. The system was continuously refined over the summer. The system was assessed for its consistency when used in a handling chute and a parlour and showed similar scores between the two handling systems.
Body Condition Scoring Benchmarking Study Results
Five farms participated in the benchmarking portion of the study. Farm size varied from less than 200 milking goats to approximately 900 milking goats. A total of 1198 goats were scored, additional data was collected such as breed, days in milk (DIM), lactation number, and milk yield when available. The data was compared to BCS, which was broken down into the following categories: 1-1.75, 2-2.75, 3.0, 3.25-3.75, 4.0+. The following information is a summary of the data collected.
The average percentage of goats in each BCS category is shown in figure 3. Of the goats score 1.84% of goats had a BCS of under 2.0, and 6.26% had a BCS of 4.0 and over.

Figure 2. Percentage of goats across all farms in each BCS category.
By Lactation
BCS was compared between first lactation goats in figure 5 and later lactation goats in figure 6. Goats in their first lactation, on average, had a lower percentage of goats in the under 2.0 and 4.0 and over categories. Goats in later lactations had greater variation in BCS, with higher percentage of goats in the under 2.0 and 4.0 and over categories.
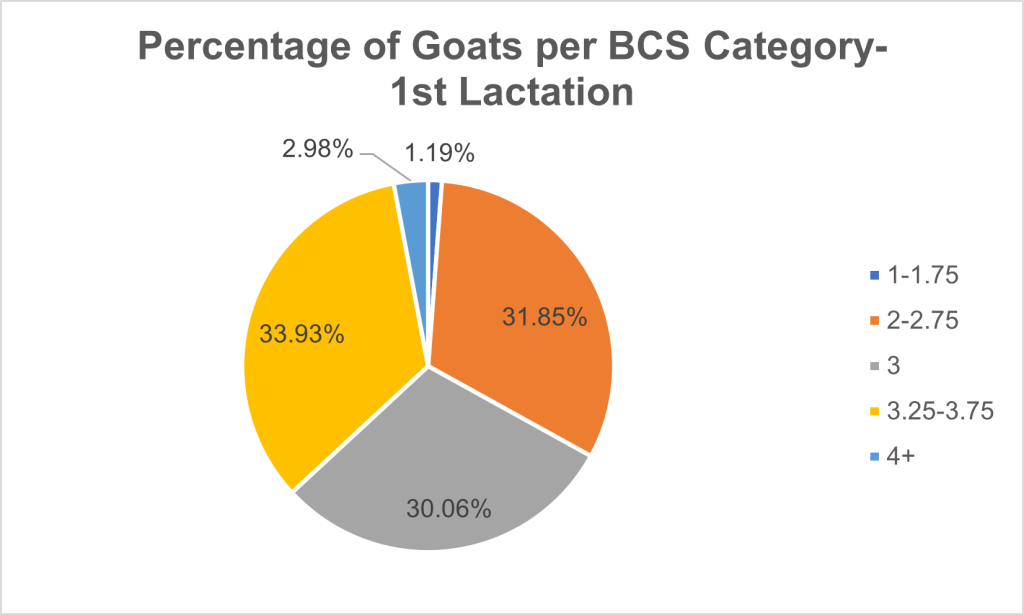
Figure 3. Percentage of first lactation goats per BCS category.

Figure 4. Percentage of later lactation goats per BCS category.
By Days in Milk (DIM)
BCS was compared between different categories of DIM. BCS is expected to fluctuate throughout the production cycle as a goat’s energy balance changes during lactation. Table 1 shows the BCS variation throughout lactation, with figure 5 showing the number of goats in each DIM category by BCS. Note that there were only 33 goats in the 201-330 DIM group. With low numbers and different farms, the BCS collected is interesting but doesn’t show significant differences between the DIM ranges.
Table 1. Number of goats in each BCS category by DIM.
| DIM | Total Goats | 1-1.75 | 2-2.75 | 3 | 3.25-3.75 | 4+ | Avg BCS |
| 1-100 | 332 | 8 | 133 | 71 | 99 | 21 | 2.96 |
| 101-200 | 212 | 3 | 100 | 69 | 37 | 3 | 2.86 |
| 201-330 | 33 | 0 | 5 | 4 | 18 | 6 | 3.40 |
| 331+ | 610 | 11 | 143 | 141 | 272 | 43 | 3.14 |
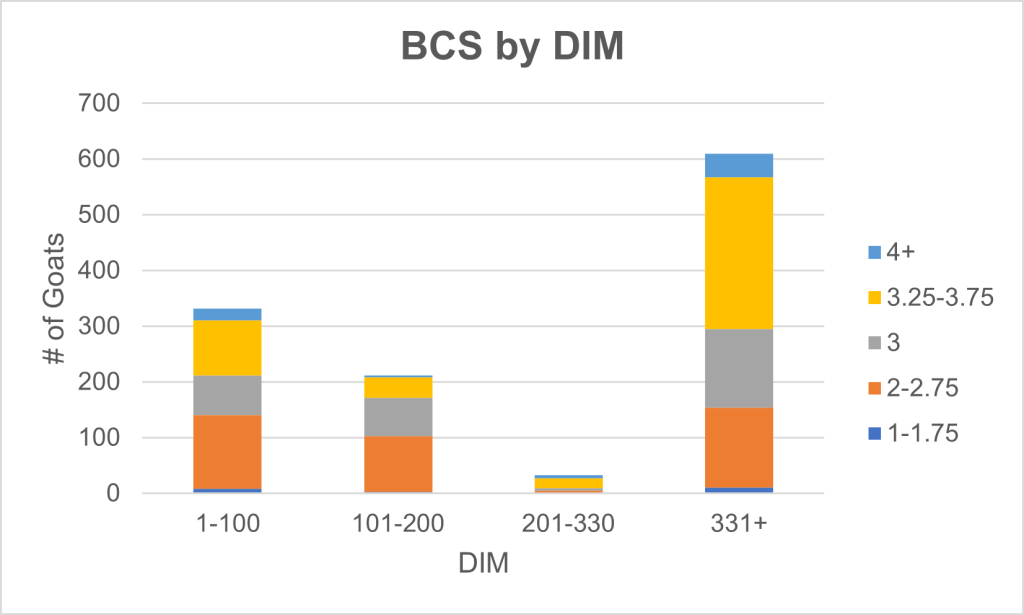
Figure 5. Number of goats in each BCS category in each range in DIM.
By Breed
BCS was compared between different breeds in Table 2 and Figure 6. This information might show trends within farm but has no significance between farms. The most common breed was Saanen. Note that the breeds were determined by visual observation and are a mix of cross and purebreds.
Table 2. Number and percentage of goats in each BCS category by breed.
| BCS | Alpine | Saanen | Lamancha | |||
| Total Goats | 319 | 775 | 77 | |||
| 1.0-1.75 | 5 | 1.6% | 16 | 2.1% | 1 | 1.3% |
| 2.0-2.75 | 103 | 32.3% | 252 | 32.5% | 13 | 16.9% |
| 3.0 | 73 | 22.9% | 191 | 24.7% | 16 | 20.8% |
| 3.25-3.75 | 111 | 34.8% | 277 | 35.7% | 39 | 50.7% |
| 4.0+ | 27 | 8.5% | 39 | 5.0% | 8 | 10.4% |
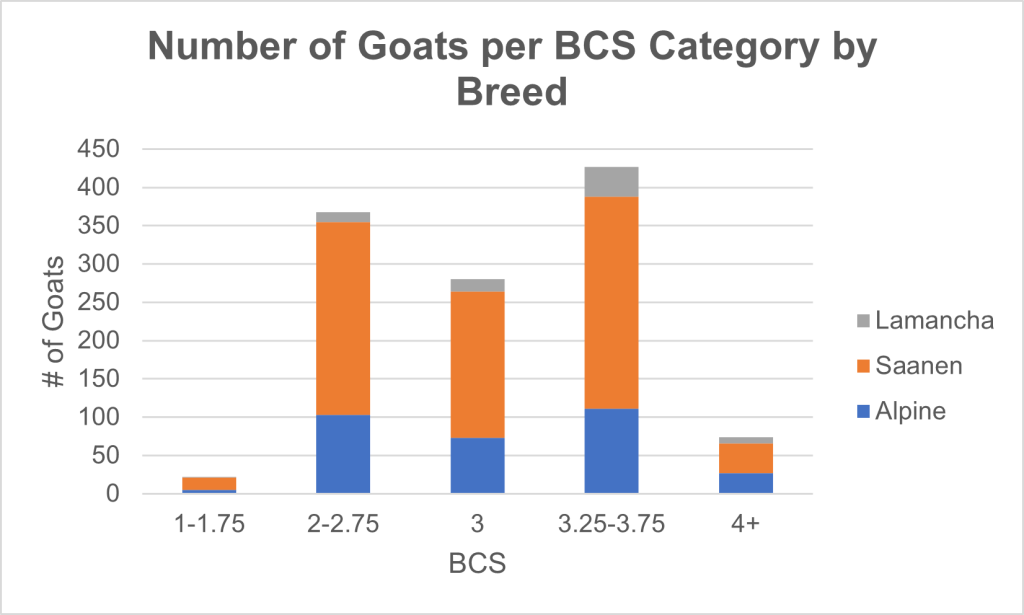
Figure 6. Number of goats by breed in each BCS category.
By Milk Yield
Milk yield was available for 689 of the goats that were body condition scored. There is a large range in milk yield for each BCS category, as seen in figure 8. Goats with a BCS of 2.0 and under and 4.0 and over tended to have a lower milk yield.

Figure 7. Variation in milk yield by BCS.
Conclusion
In general, the dairy goats observed are in good condition. Due to the large range in milk yield at each body condition score, there may be opportunities to refine feed management for those goats who are lower producers with body condition scores over 3.