By Christopher Llewellyn and Delma Kennedy. This article provides an overview of the state of the Ontario sheep industry as of Fall 2024.
Highlights
Market Demand
- Population Growth: Ontario’s population reached approximately 15.9 million in 2024, an increase of almost 500,000 people in the past year. This growth is expected to drive increased demand for locally sourced sheep products.
- Domestic Protein Demand: The average Canadian consumption of lamb and mutton was estimated at .94kg of retail yield per person in 2023, a slight decrease from 2022.
Inventory Trends
- Ontario remains the leader in Canada’s sheep industry, with the largest breeding flock totaling 193,600 animals as of January 2024, down from 198,700 in January 2023. Ontario’s overall sheep population decreased from 265,500 in January 2023 to 259,400 in January 2024.
- Nationally, Canada’s sheep population reached approximately 823,400 as of January 2024, marking a decrease from the January 2023 estimate of 846,800 but an increase compared to the January 2022 estimate of 822,200.
Market Prices
- Lamb Prices: In Ontario, the average price for 80-94lb lambs dropped by about 7.7% from $297.19 in 2022 to $274.36 in 2023. This recent decline follows an overall upward trend in lamb prices over the longer term. 2024 has shown relatively high prices, being higher than 2023 in each month, as of July 2024.
- Costs: Overall farm input price to raise an 80-94lb lamb rose by approximately 5.3%, from $143.20 in 2022 to $150.80 to 2023.
Lamb Supply
- Production: Lamb and mutton production in Canada increased to 17.52 thousand tonnes in 2023, up from 17.1 thousand tonnes in 2022.
- Imports: Canadian lamb and mutton imports totaled 23.23 thousand tonnes in 2023, down from 27.92 thousand tonnes in 2022.
- Exports: Exports saw a slight increase to 0.12 thousand tonnes in 2023 from 0.07 thousand tonnes in 2022.
- Self-Sufficiency Ratio: The self-sufficiency ratio improved slightly to 0.43 in 2023 from 0.38 in 2022, indicating a modest increase in domestic production relative to consumption. Consumption typically increases with greater supply from domestic production and imports.
Slaughter and Trade
- Slaughter Trends: Provincial sheep and lamb slaughter in Ontario increased by 11.1% from 283,403 in 2022 to 314,805 in 2023. Federal slaughter continues to be less than 1% of slaughter.
- Trade: The Canadian lamb and mutton import market remains dominated by Australia and New Zealand, with Australia providing about 50% and New Zealand approximately 40% of imports. Ireland has become a notable supplier, representing around 6% of imports.
Wool Market
- Prices: Wool prices have experienced significant volatility. In 2022, the average price in Ontario was $0.28 per kilogram, lower than the national average of $0.38 per kilogram. This is a substantial decline from the $1.48 per kilogram price in 2016, highlighting ongoing challenges for wool producers.
Demand
Domestic Protein Demand
In Canada, the average annual consumption of various animal proteins reveals distinct dietary preferences. Figure 1 reveals that poultry leads with 41.27 kg per person per year, followed by pork at 17.38 kg and beef at 16.23 kg. Fish and eggs also contribute significantly to the diet, with average consumptions of 7.76 kg and 21.21 dozen, respectively. Lamb and mutton, however, account for a smaller share, averaging just 0.94 kg per person per year.
Comparing this to the previous year, when consumption was 0.98 kg, there has been a decrease of approximately 4.1%. This decrease is moderate considering production and the decrease in imported product. This type of change is common for the sheep industry. Although it is expected that there would be a growing interest, lamb and mutton represent a minor portion of the total meat consumption in Canada.
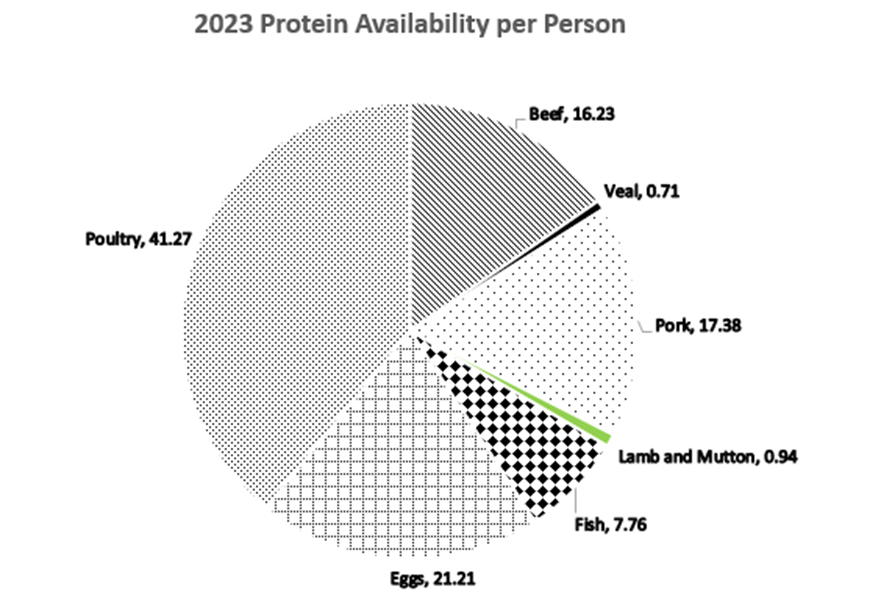
Figure 1. Average Canadian animal protein available per person in 2023. Eggs are reported in dozens, poultry in kg carcass weight and all others in kg retail weight. Source: AAFC
Ontario’s Growing Population
Ontario’s population has demonstrated a consistent upward trajectory over the past few decades, reaching approximately 15.9 million in 2024. This steady growth reflects broader demographic trends, with a notable deceleration between 2020 and 2021 attributable to the impacts of the COVID-19 pandemic, which restricted migration and reduced population mobility. Despite this, the increase in population between 2019-2024 at 1.46 million was almost double the population increase from 2015-2019.
For the sheep industry, this population growth suggests an expanding market for both meat and wool products. As the number of residents rises, so too does the demand for locally sourced agricultural products, including sheep meat and wool. In order to offer the same volume of sheep and lamb meat per person, more production is needed or more product must be imported. This creates an opportunity for the Ontario sheep sector.
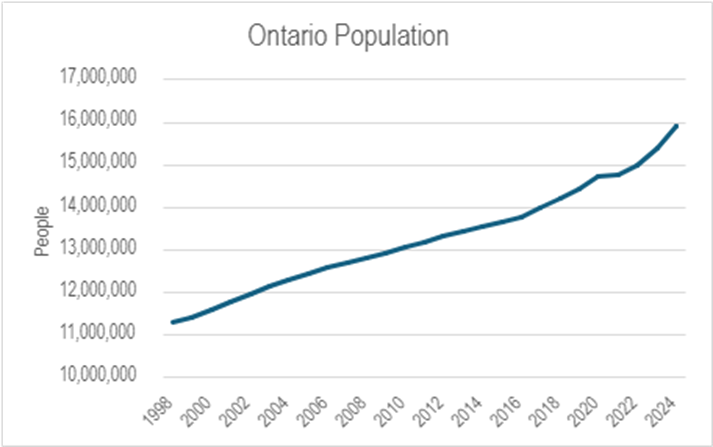
Figure 2. Ontario human population by year. Source: StatCan.
Inventory Trends
As of January 2024, Canada has a sheep population of approximately 823,400, marking an increase from January 2021, when the sheep population was 813,700. This rise reflects a growth of about 1.2% over the three-year period, indicating a positive trend in the Canadian sheep industry.
On a global basis, Canada occupies a modest position compared to the world’s leading producers, as shown in Table 1. China, by far the largest producer, boasts an impressive sheep population of 194 million, followed by India and Australia, with 75.4 million and 70.2 million sheep respectively.
| Rank | Country | # Sheep |
| 1 | China | 194,030,298 |
| 2 | India | 75,345,847 |
| 3 | Australia | 70,234,655 |
| 4 | Iran | 55,582,000 |
| 5 | Nigeria | 50,284,350 |
| 6 | Chad | 45,081,553 |
| 7 | Turkey | 44,687,888 |
| 8 | Sudan | 41,332,641 |
| 9 | Ethiopia | 35,069,956 |
| 10 | United Kingdom | 33,066,000 |
| 15 | New Zealand | 25,333,562 |
| 84 | Canada | 822,200 |
| 177 | World Total | 1,321,535,794 |
Table 1. Sheep populations of relevant countries, 2022. Source: FAO Stat Sheep Stocks 2022. Accessed November 4, 2024
Inventory in Canada
Flock size in each province varies significantly. Figure 3 shows that, as of January 1, 2024, Ontario maintains its position as the province with the largest sheep flock, totaling 259,400 animals. This represents a decrease from 265,500 on January 1, 2023. Alberta has risen to the second-largest flock with 169,000 sheep, surpassing Quebec. Quebec’s flock has decreased to 167,600 from 173,600 in 2023.
According to Statistics Canada’s January 1, 2024, livestock estimate, the total number of sheep and lambs across Canada has decreased by 2.8% from January 2023, bringing the national total to 823,400 head. All provinces experienced decreases in their sheep populations except for Nova Scotia and New Brunswick which saw their populations grow by 300 animals each.
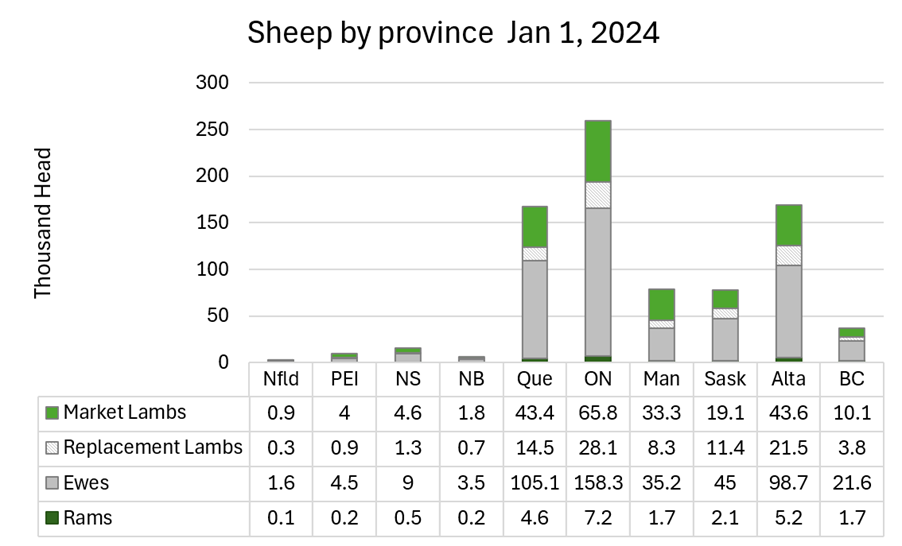
Figure 3. Thousand head sheep by province, by type. Shows the 2024 flock size and make-up for each province. Source: Statistics Canada November 4, 2024.
Inventory in Ontario
Ontario boasts the largest breeding flock in Canada, representing 31.5% of the national total. As illustrated in Figure 4, while Ontario’s breeding flock generally mirrors national trends, it uniquely recovered from the significant decline seen in 2006 by 2011. However, since 2011, the province’s breeding flock has decreased by 11.4%, bringing the total to 193,600 breeding ewes, rams, and replacement stock as of January 2024.
The overall size of Ontario’s sheep flock has also seen a slight decline, with the total inventory at 259,400 head, down from 265,500 in 2023. The breeding flock, specifically, decreased by 2.6% from 198,700 in January 2023 to 193,600 in January 2024. This reduction is largely attributed to a 2.5% decrease in the number of breeding ewes and 3.8% decrease in replacements, while the number of rams remained stable at 7,200 head.
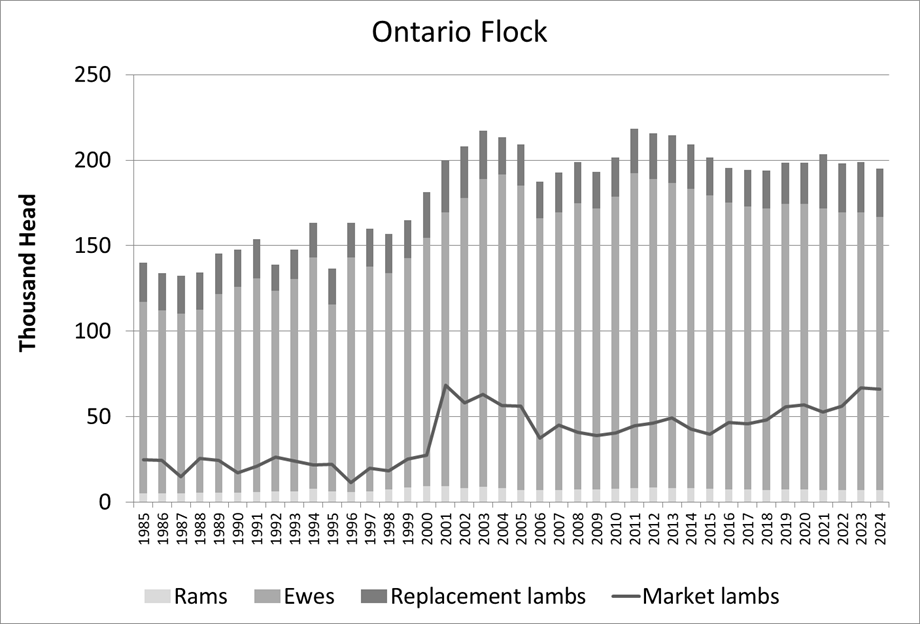
Figure 4. Ontario Sheep Flock, January 1 by Year, by Animal Class. Shows yearly changes in the Ontario sheep flock, by sheep class since 1990. Source: Statistics Canada.
Price and Cost Trends
Alongside price, input cost must also be considered in determining profitability. As shown in Figure 5, between 2022 and 2023, the average price for 80-94 lb lambs decreased by approximately 7.7%, falling from $297.19 to $274.36. This decline reflects a broader trend of year-to-year fluctuations in lamb prices, though the overall trajectory has been upward over the longer term.
In contrast, the breeding flock size remained stable, rising from 198,100 to 198,700. Over the same period, the overall farm input price index rose by approximately 5.3%, increasing from 143.20 to 150.80. This highlights that while lamb prices declined in 2022 and 2023, the costs associated with maintaining breeding flocks and general farm inputs have risen. As a result, sheep farmers faced a more challenging financial environment where input costs are increased as lamb prices experienced a downturn.
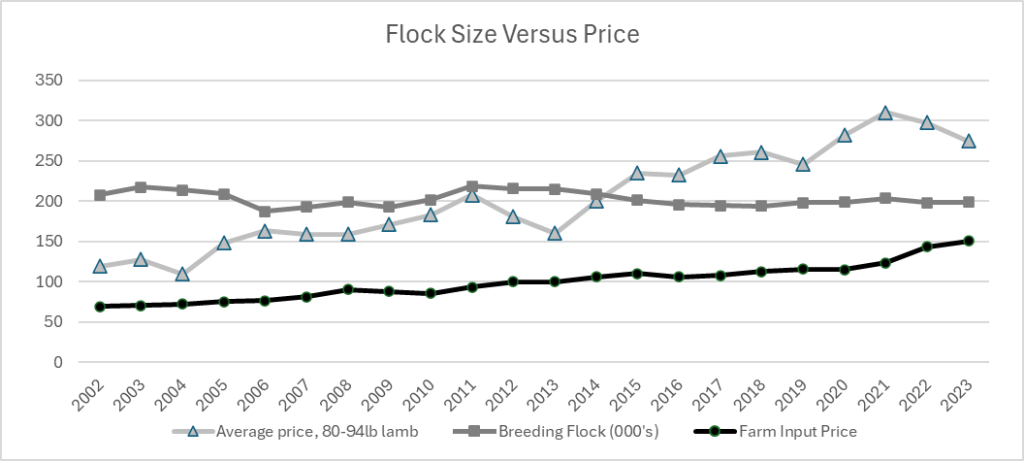
Figure 5. Average price of 80-94lb lamb($/CWT), breeding flock size (000’s), and farm input price index by year. Source: AAFC
Lamb Prices
Lamb prices in Ontario generally demonstrate a pattern of seasonal fluctuation throughout the year. The shaded area of Figure 6 shows the range of average prices from 2015-2019 by month. This is a normal price pattern with the highest prices around Easter and lower prices in summer and fall. The usual price pattern was disrupted in 2020 (the dotted line). Since 2020, prices have tended to be more volatile. The black line for 2014 is included to illustrate price during the last price crash.
In 2024, the price for lambs weighing under 79 pounds reached a peak of $397.15/CWT in April. Lambs weighing between 80 and 94 pounds also peaked in April at $379.74/CWT still short of the 2021 high of $402.56/CWT, as shown in Figure 6. Larger lambs tend to experience their price peaks slightly later than lighter lambs and generally at lower prices. Smaller lambs generally command higher prices compared to larger ones, reflecting the premium typically associated with their size.
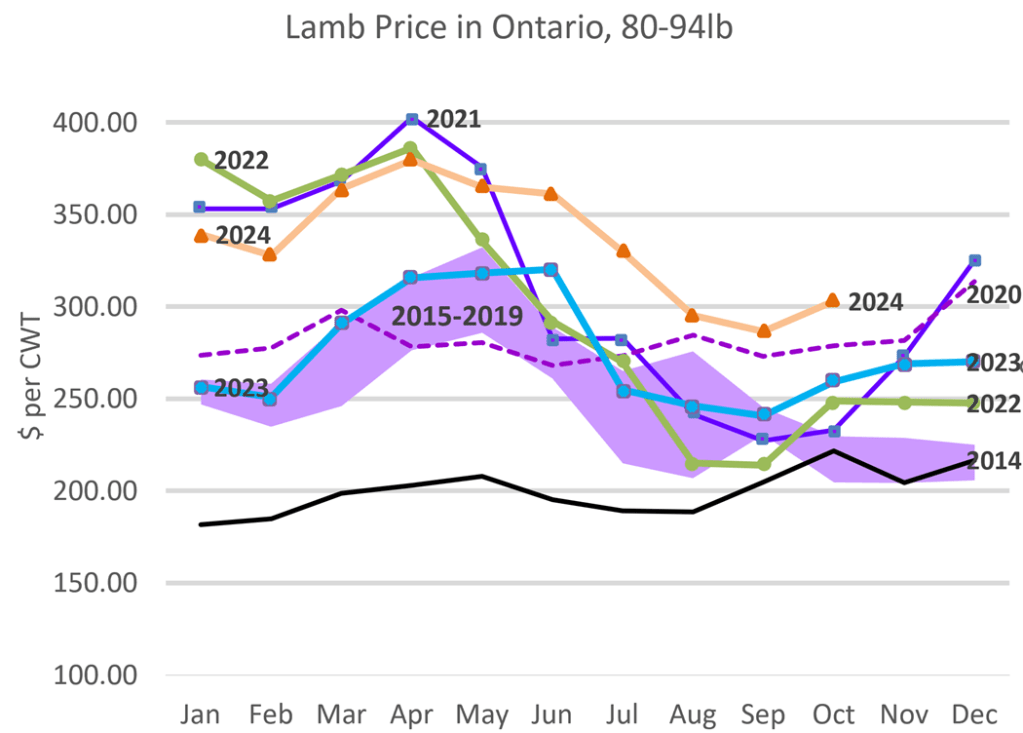
Figure 6. Price of lambs by month, by year, for lambs weighing between 80-94lbs. Source: AAFC
Ontario Auction Volume
The data shown below in Figure 7 for live auction numbers of sheep by weight from 2009 to 2023 reveals several trends and notable changes over the years.
Overall, there has been a gradual increase in the total number of sheep and lambs sold at auctions from 2009 to 2023, reaching a peak in 2023 with 284,078 head sold. This growth reflects a general upward trend in auction numbers over the past decade. The weight categories have shown varied patterns, with fluctuations in the number of sheep sold in each weight class year over year. From 2009 to 2023, the number of sheep sold in the over 80lb weight categories has increased from 42.4% of lambs marketed to 57.5% of the lambs marketed illustrating the trend towards heavier sheep being sold.
Weight Categories:
Examining the data by weight categories reveals diverse trends:
New Crop: This is a small category of lambs based on weight and a just weaned appearance. The number of sheep sold in this category increased from 9,969 in 2022 to 11,339 in 2023, showing a significant increase of 1,370 head or about 13.7%.
<79 lbs: There was a small decrease from 84,119 in 2022 to 83,457 in 2023, representing a reduction of 662 head or about 0.8%.
80-94 lbs: The number in this category increased from 54,259 in 2022 to 61,266 in 2023, an increase of 7,007 head or about 12.9%.
95-109 lbs: The number of lambs in this category decreased from 53,553 in 2022 to 51,168 in 2023, a reduction of 2,385 decrease of 4.5%
110+ lbs: This category also saw a decrease from 18,889 in 2022 to 15,532 in 2023, a reduction of 3,357 head or about 17.8%.
Overall, between 2022 and 2023, the total number of sheep and lambs sold increased by 4,095 head, or 14.6%. The increase in market volume in the past 3 years indicates that more out of province animals are likely be being sold since the Ontario breeding flock is not growing.
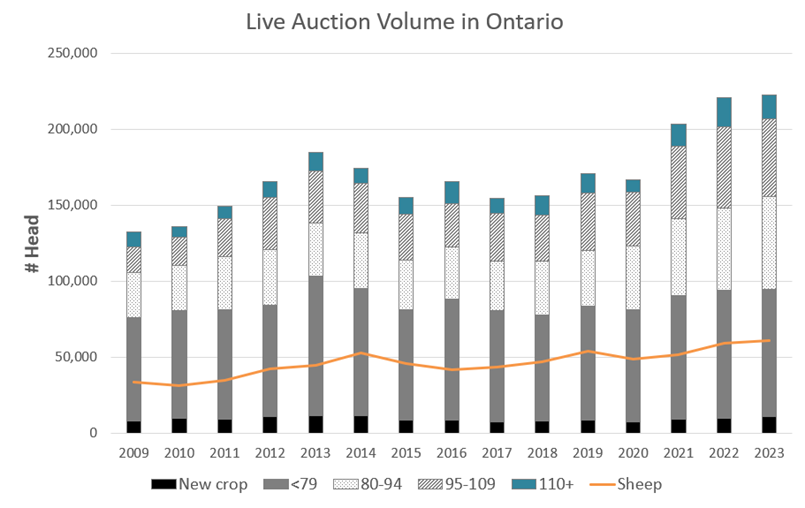
Figure 7. Live-auction # lambs sold by weight and year, and adult sheep sold by year. Source: AIMIS
Farm Cash Receipts
Figure 8 shows how, in 2023, the cash receipts from sheep and lamb production saw a minor decline, falling from $90,249,000 to $90,056,000. This segment of the livestock sector continues to hold a modest 1% market share, with most of the cash receipts being dominated by cattle, poultry, and swine. Cattle and calves lead the sector with $2,162,056,000, followed by poultry and eggs at $2,258,209,000, and hogs at $1,691,565,000. The relatively stable performance of sheep and lambs, despite their small market share, reflects their niche role within the broader livestock industry.
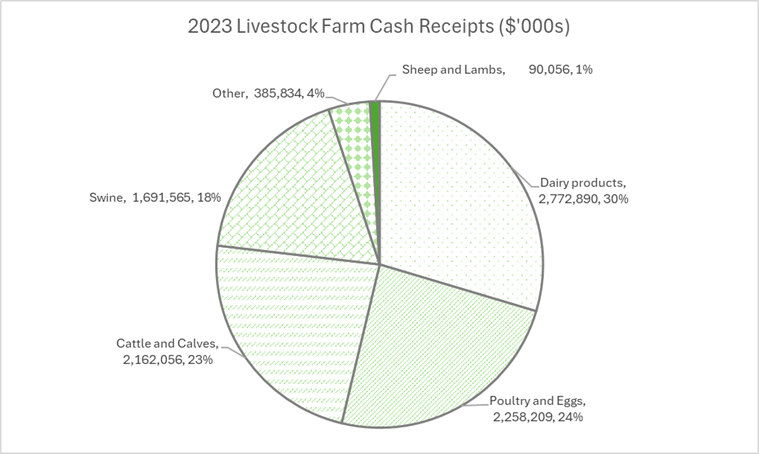
Figure 8. Canadian livestock farm cash receipts in 2023 by livestock type. Source: Statistics Canada
Slaughter
Slaughter in Canada
Figure 9 illustrates trends in sheep and lamb slaughter across the West-Ontario and Quebec-Atlantic regions from 1993 to 2023. In West-Ontario, the slaughter numbers increased by 9.7%, rising from 416,076 in 2022 to 456,338 in 2023. Similarly, the Quebec-Atlantic region saw an increase of about 9.3% in slaughter numbers, climbing from 138,067 in 2022 to 150,924 in 2023.

Figure 9. Sheep and lamb slaughter in Canada by year, by region. Source: AAFC.
Slaughter in Ontario
Ontario relies heavily on provincially regulated slaughterhouses, making up 99.5% of total slaughter volume, as shown in Figure 10. Between 2022 and 2023, the sheep and lamb slaughter volumes in Ontario demonstrated significant changes. The provincial slaughter volume increased by about 11%, rising from 283,403 animals in 2022 to 314,805 in 2023.
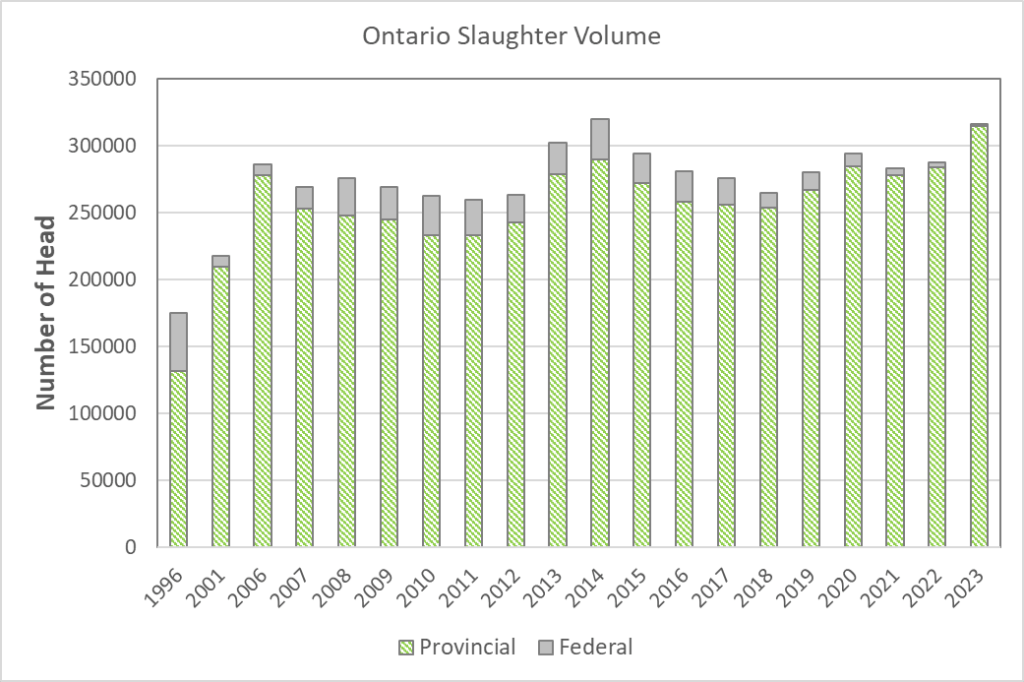
Figure 10. Sheep and lamb slaughter volume in Canada by year, by provincially or federally overseen slaughterhouses. Source: AAFC.
Lamb and Mutton Trade
Import and Export
In recent years, both domestic and provincial lamb imports in Canada have exhibited a general upward trend, with a peak in 2022, as seen above in Figure 11. Domestic imports reached 28.4 million kg, while Ontario’s imports hit 20.2 million kg. However, these figures decreased in 2023, with domestic imports falling to 25.2 million kg and Ontario’s imports to 17.6 million kg. Despite these recent declines, the long-term trend indicates a steady increase in imports since 2012, which is anticipated to continue as demand persists. Canada has a small lamb and mutton export business that in recent years has fluctuated between 70 and 160 tonnes.
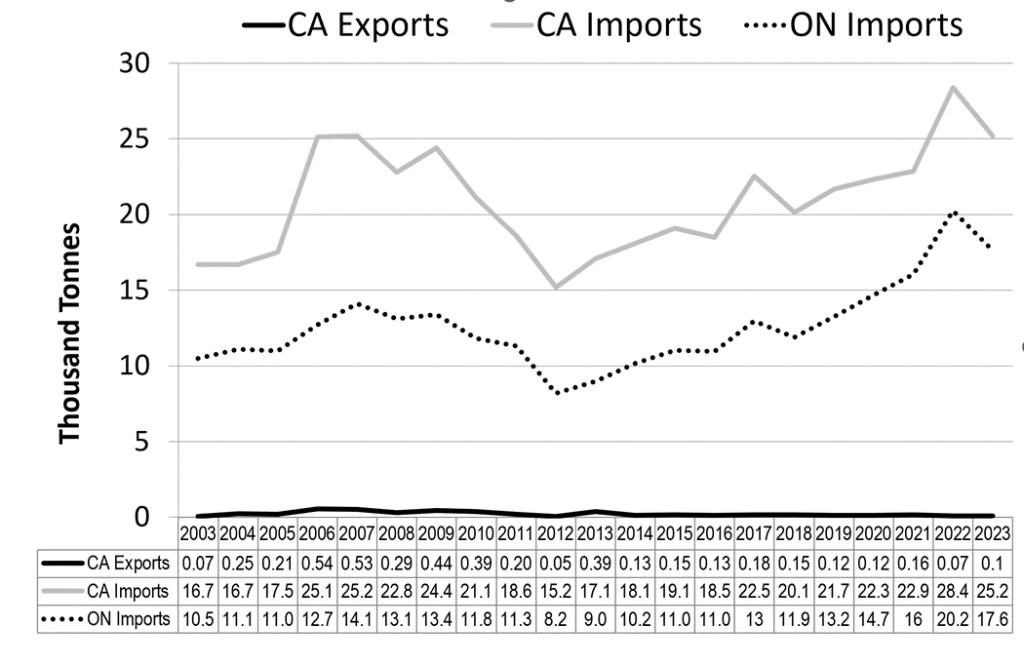
Figure 11. Canadian lamb and mutton import and export by year, Ontarian imports by year. Source: StatsCan, Canadian International Merchandise Trade database.
Supply vs Price In recent years, lamb production in Canada has shown relative stability with minor fluctuations. The production increased slightly from 17.1 million kg in 2022 to 17.52 million kg in 2023 (Figure 12). Most of the change in overall supply from year to year comes from changes in volume of imported product. Price has been on an upward trend overall and does not always decrease when supply increases or increase when supply decreases indicating that forces outside of our Canadian market affect price.
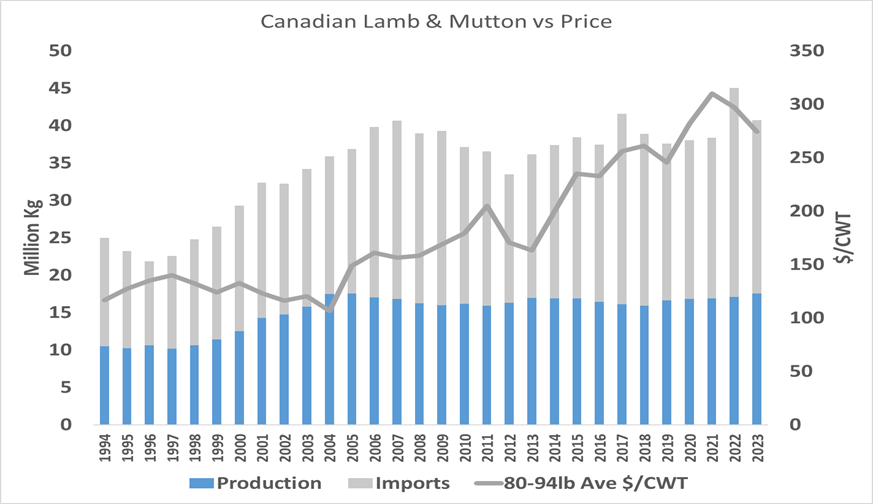
Figure 12. Canadian lamb and mutton production by year, imports by year, and 80-94lb lamb price, by year. Source: StatsCan, Supply and Disposition of Food.
Imports by Country
Australia and New Zealand dominate the Ontario lamb and mutton import market, with these countries collectively accounting for most imports (Figure 13). Since 2013, Australia has doubled its market share in Ontario. In 2023, Australia supplied about 50% of Canada’s lamb and mutton imports, while New Zealand provided approximately 40% and Ireland supplied about 6.5%.
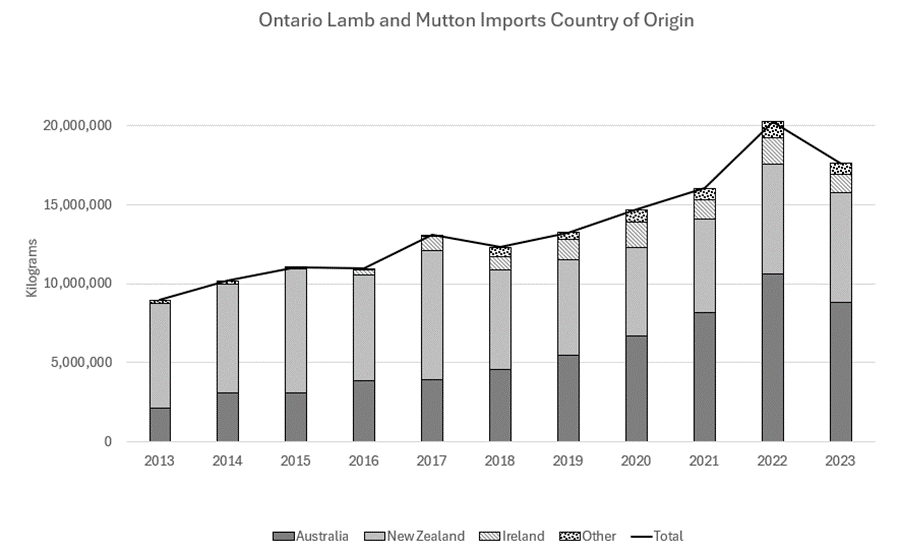
Figure 13. Lamb and mutton import to Ontario by country, by year. Source: CIMT.
Self Sufficiency
The Canadian sheep industry generally only supplies about 40% of the lamb and mutton consumed in Canada. Statistics Canada estimates supply and disposition of lamb and mutton in Canada. In 2023, lamb and mutton production estimates increased to 17.52 thousand tonnes, up from 17.1 thousand tonnes in 2022 and 16.86 thousand tonnes in 2021. Despite this increase in production, imports decreased resulting in an improved self sufficiency due to a smaller overall supply of lamb and mutton.
The net supply of lamb and mutton, which combines production and imports while subtracting exports, was 40.63 thousand tonnes in 2023. This figure represents a decrease from 44.95 thousand tonnes in 2022 but is still higher than the 38.2 thousand tonnes recorded in 2021.
Wool
The average price of raw wool has seen significant volatility over the past two decades, with a marked decline in recent years. Figure 14 shows how, since 2015, wool prices have decreased substantially, reaching their lowest levels since the turn of the millennium. In 2022, the average price of wool in Ontario was $0.28 per kilogram, compared to Canada’s national average of $0.38 per kilogram. This indicates that Ontario’s wool prices were 74% of the national average, reflecting a consistent pattern of lower pricing in the province compared to the rest of the country. Wool has become waste to some operations as trucking costs overtake wool value.
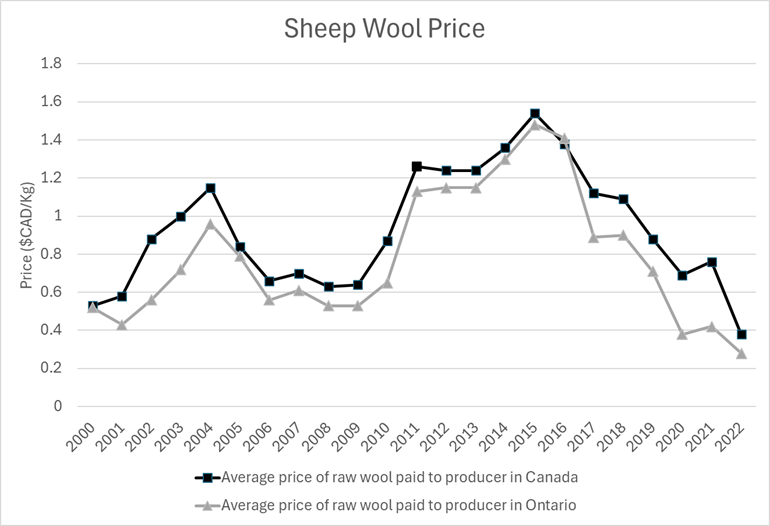
Figure 14. Sheep wool price for Ontario and Canada by year. Source: AAFC.