A total of 83 producers submitted data, with 38.6% (32 producers) representing operations with flock sizes greater than or equal to 100. Note that most analyses broken down by flock size are based on 82 responses due to missing data. The results presented throughout this report are based on information from the 2025 production year unless otherwise noted.
Years Owning Sheep
1-99 flock size: Producers that have owned sheep for 15+ years represent the largest group (23 producers). This is followed by 10-14 years (12 producers), then less than 5 years (10 producers), and 5-9 years (5 producers).
100+ flock size: Similarly, producers that have owned sheep for 15+ years also make up the largest share (21 producers). The remaining categories include 10-14 years (5 producers), 5-9 years (4 producers), and less than 5 years (2 producers).
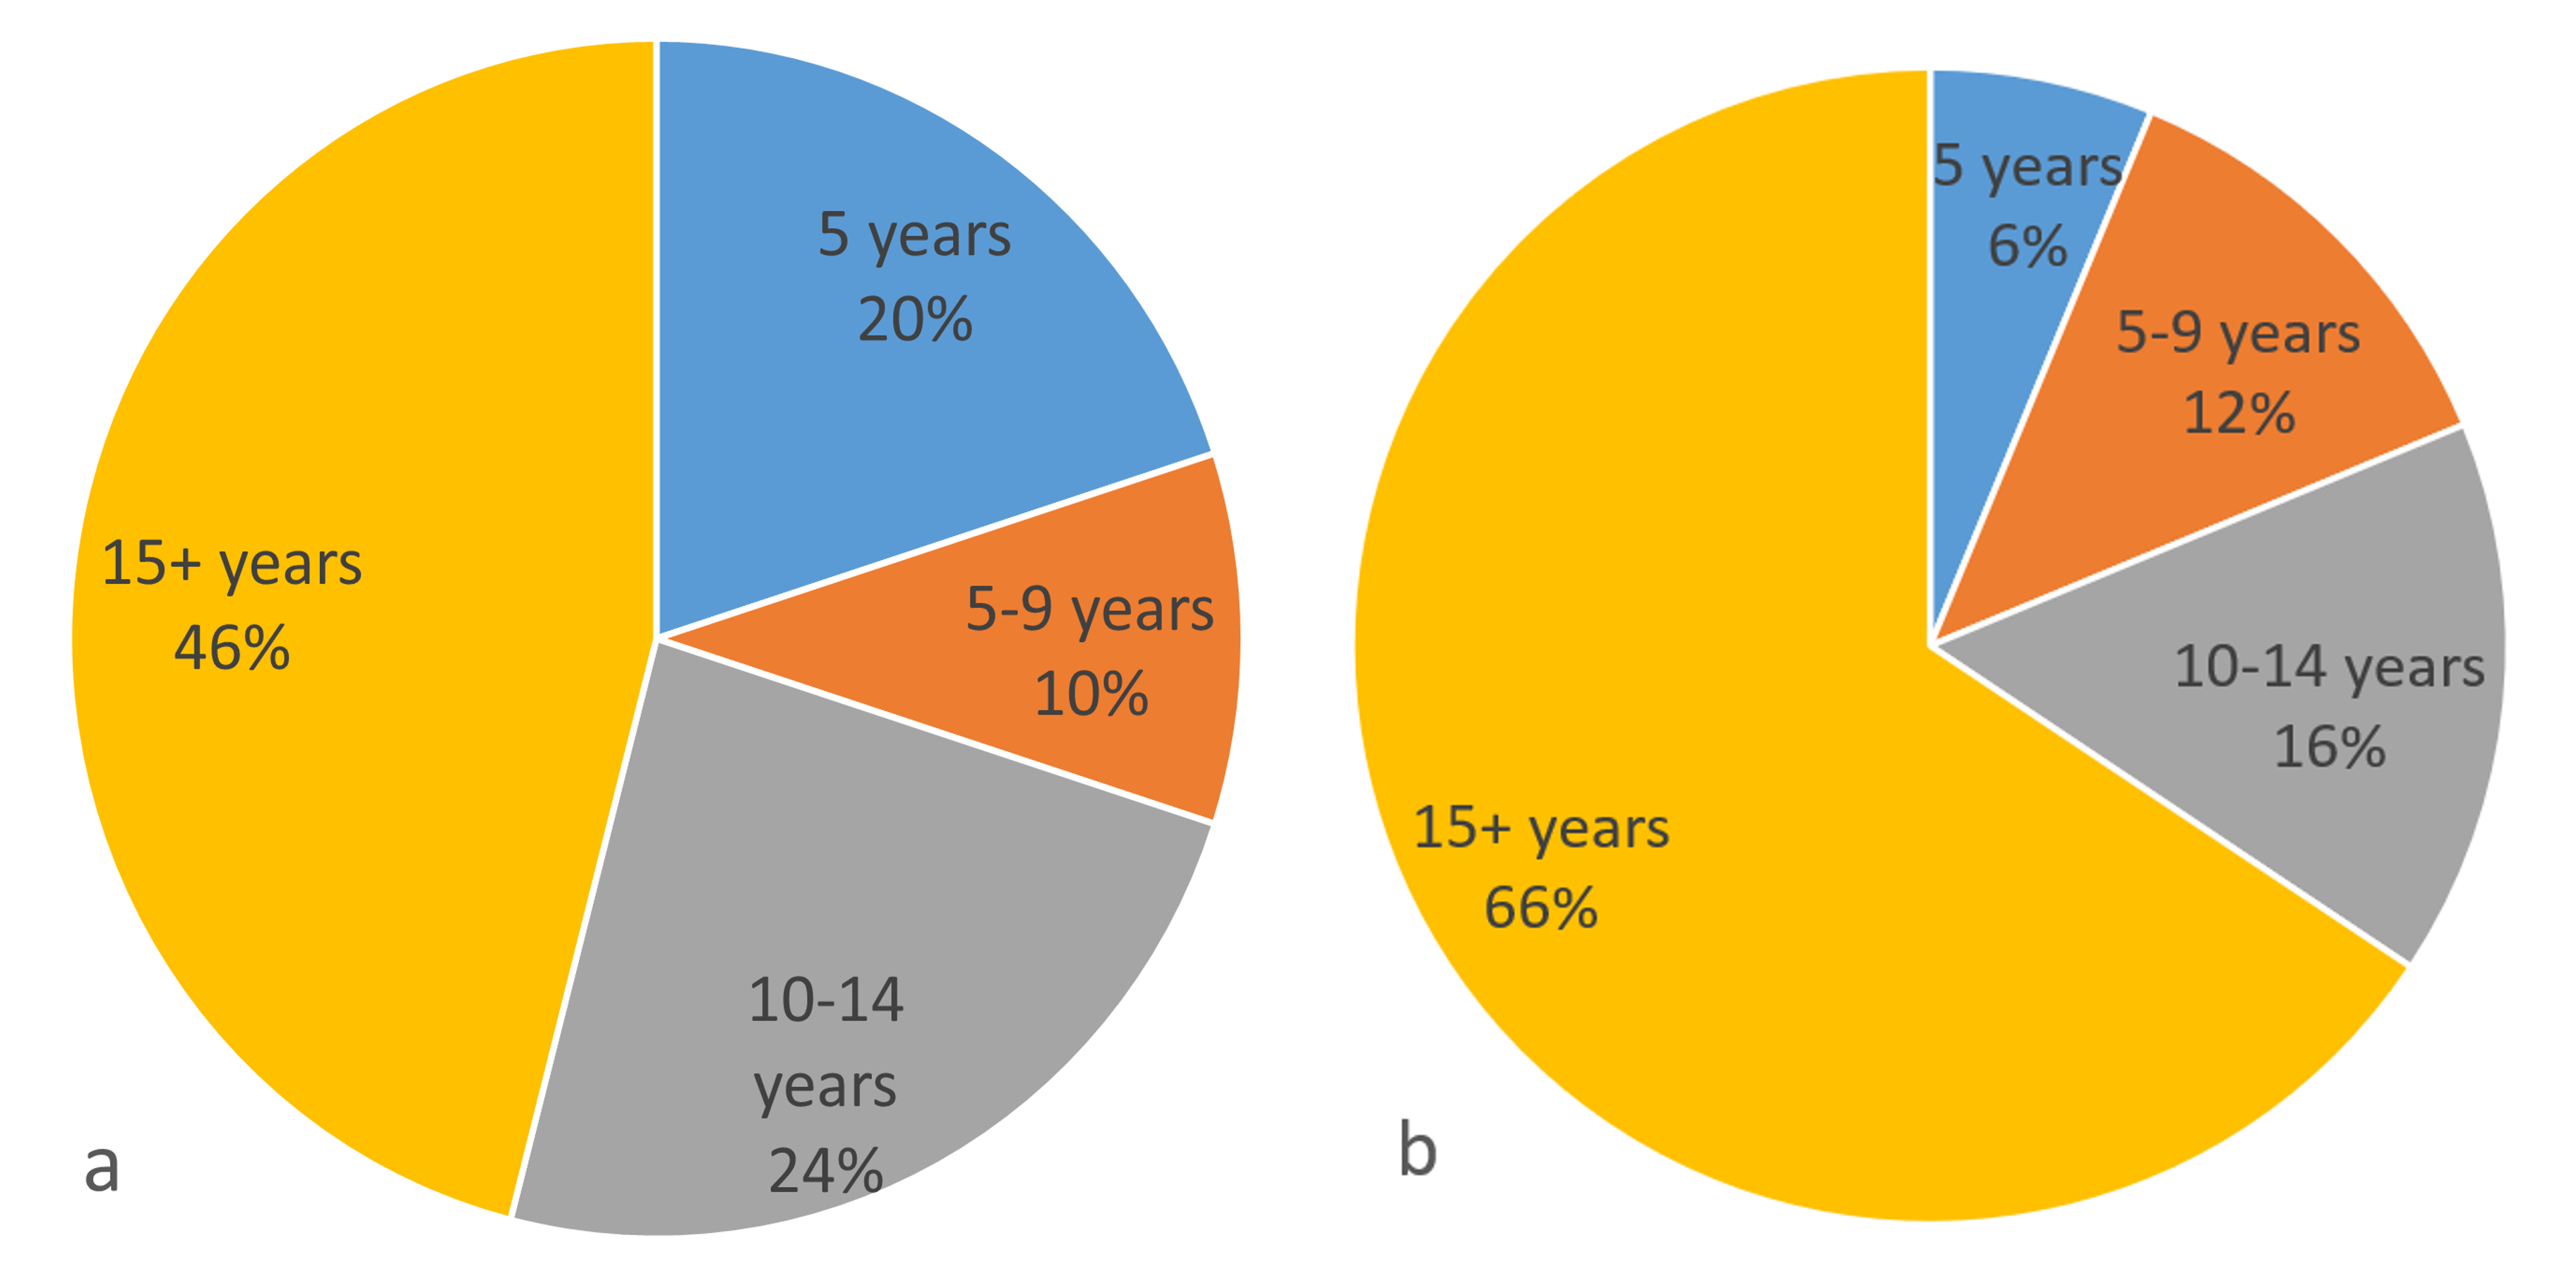
Figure 1. Distribution of years owning sheep (less than 5, 5-9, 10-14, and 15+ years) among questionnaire respondents by flock size; (a) smaller operations (1–99; n=50) and (b) larger operations (>100; n=32). The data shown reflects the 2025 production year.
Ownership Age
Of the 83 respondents, 56 producers indicated ownership by only one age group, 24 reported two age groups, and 3 reported three age groups. A total of 113 ownership age groups were reported. Of these, 38.9% reported ownership by individuals aged 56+. This is followed by 36-45 years (22.1%), 46-55 years (15.9%), 26-35 (15.9%) and 25 years or younger (7.1%).

Future Operation Plans
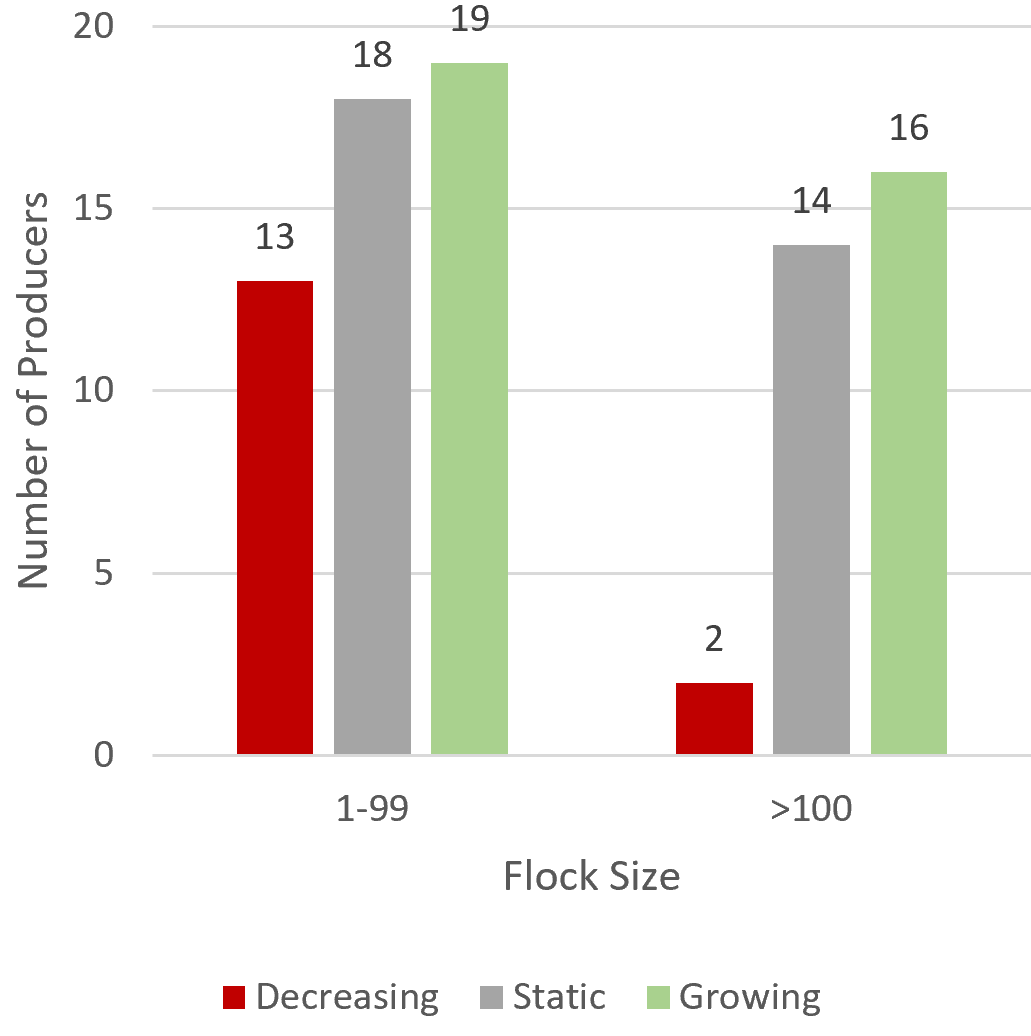
A total of 35 operations reported their plans to grow, 32 reported remaining static, and 16 reported decreasing in size.
1-99 flock size: 38% and 36% of operations surveyed noted growing and static sizes respectively. Of those surveyed, 26% had indicated decreasing operation sizes.
100+ flock size: 50% and 43.8% of operations surveyed noted growing and static sizes respectively. Decreasing operation sizes makes up a minor share of only 6.3%.
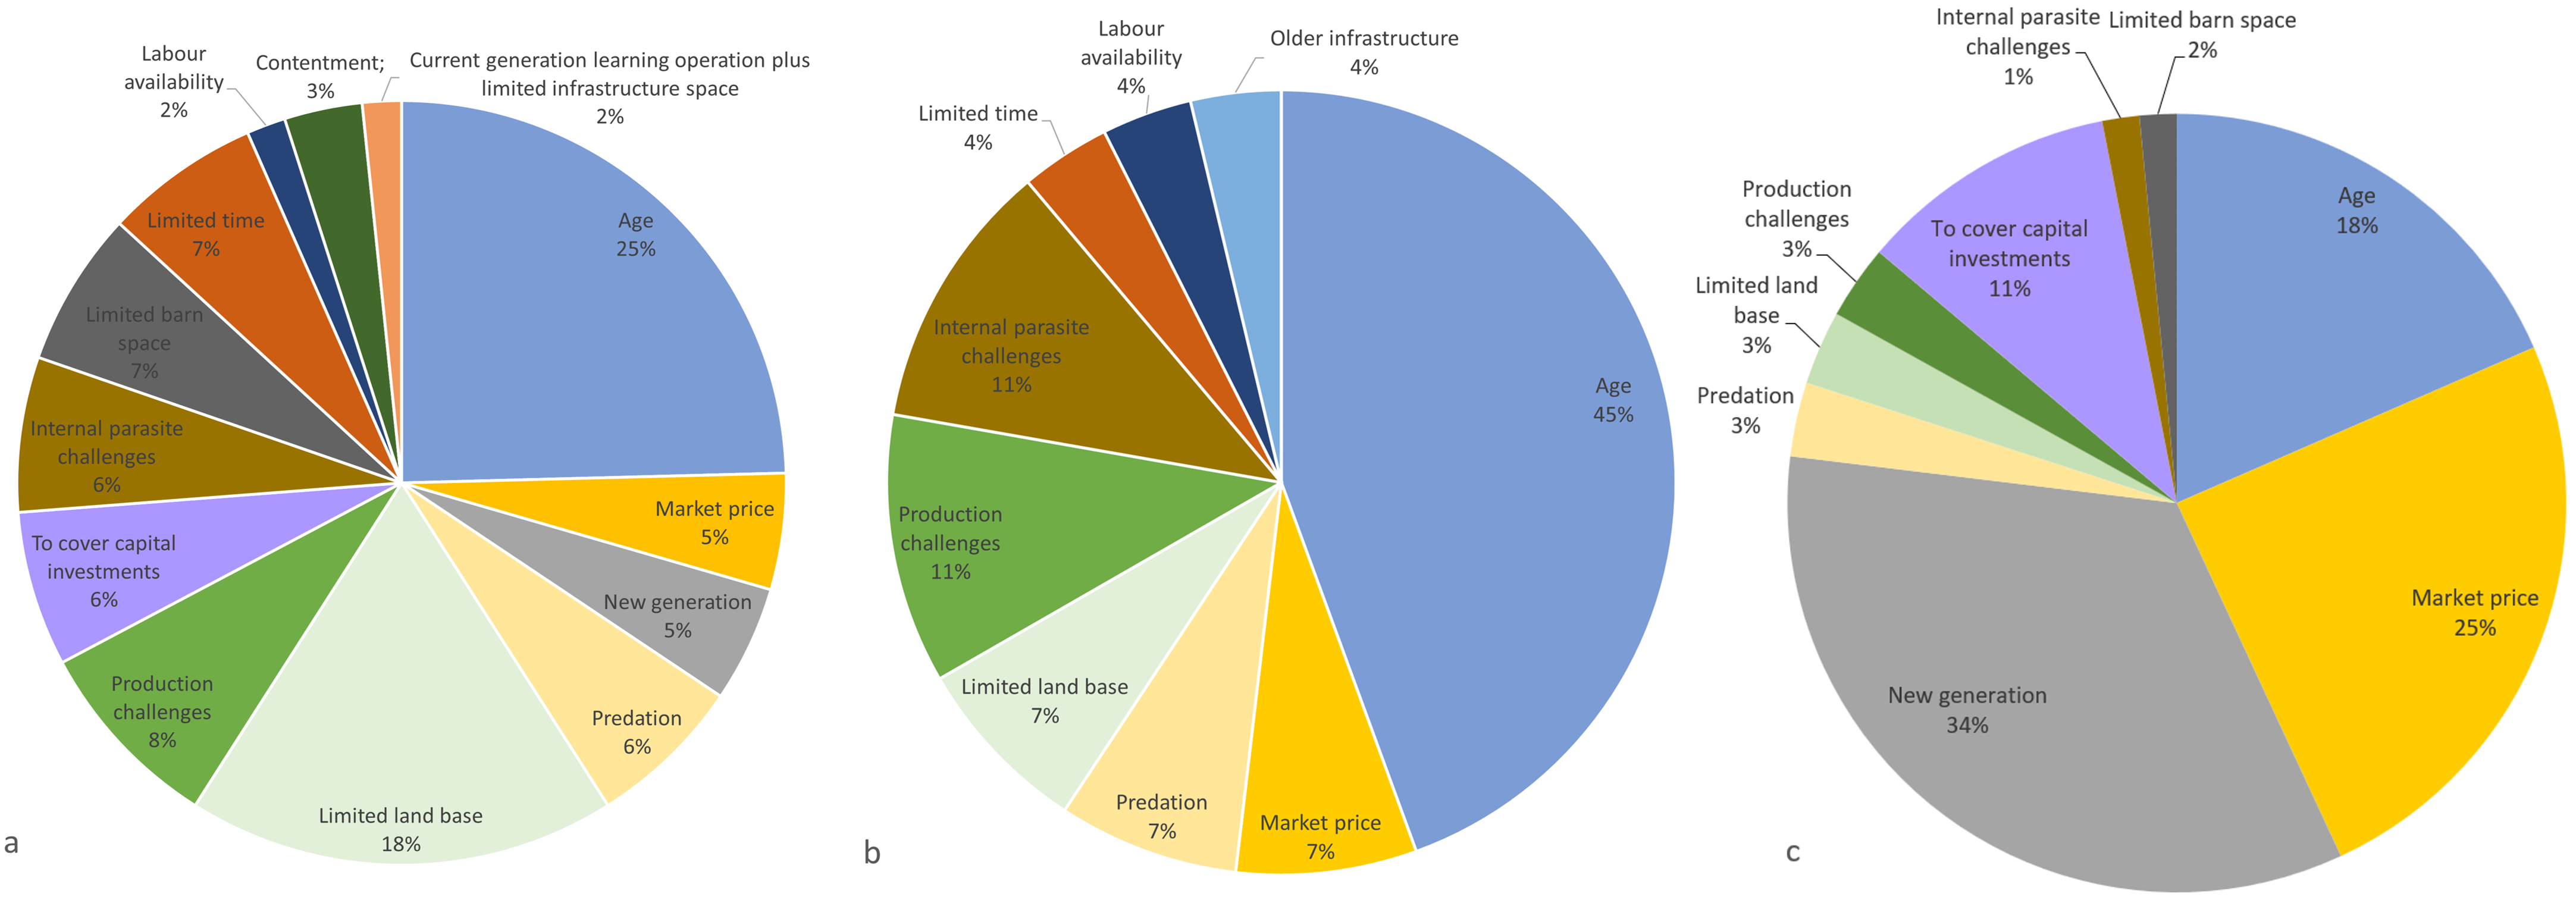
Growing Operations: Of the 35 operations growing, 20 have a single ownership age group, while 15 are multi-generational (12 operations with two ownership groups and 3 with three ownership groups). The age distribution of individuals within farms reporting growing operation size (n=53 ownership groups across 35 farms) is composed of 24.5% of owners aged 36-45 (13 producers). Individuals aged 56 or older account for 22.6% (12 producers), followed by those aged 26-35 and 46-55 (20.8% each; 11 producers each), and those aged 25 or younger (11.8%; 6 individuals). The three explanations noted most often include a new generation (indicated by 22 producers), market price (indicated by 16 producers), and age (indicated by 12 producers).
Static Operations: Of the 32 operations reporting no change in size, 23 have a single ownership age group, while 9 are multi-generational (9 operations with two ownership groups). The age distribution of ownership groups within farms reporting static operation size (n=41 ownership groups across 32 farms) is primarily composed of individuals aged 56+ (46.3%; 19 producers), followed by those aged 36-45 (26.8%; 11 producers). Individuals aged 26-35 and 46-55 each account for 12.2% (5 producers each), while those aged 25 or younger represent the smallest proportion (2.4%; 1 individual). The two explanations noted most often include age (indicated by 15 producers) and limited land base (indicated by 11 producers).
Decreasing Operations: Of the 16 operations decreasing, 13 have a single ownership age group, while 3 are multi-generational (3 operations with two ownership age groups). The age distribution of ownership groups within farms reporting decreasing operation size (n=19 ownership groups across 16 farms) is primarily composed of those aged 56+ (68.4%; 13 producers). Individuals aged 26-35 and 46-55 each account for 10.5% (2 producers each), while those aged 36-45 and 25 or younger each account for 5.3% (1 producer each). The explanation noted most often is age, which was listed by 12 producers.

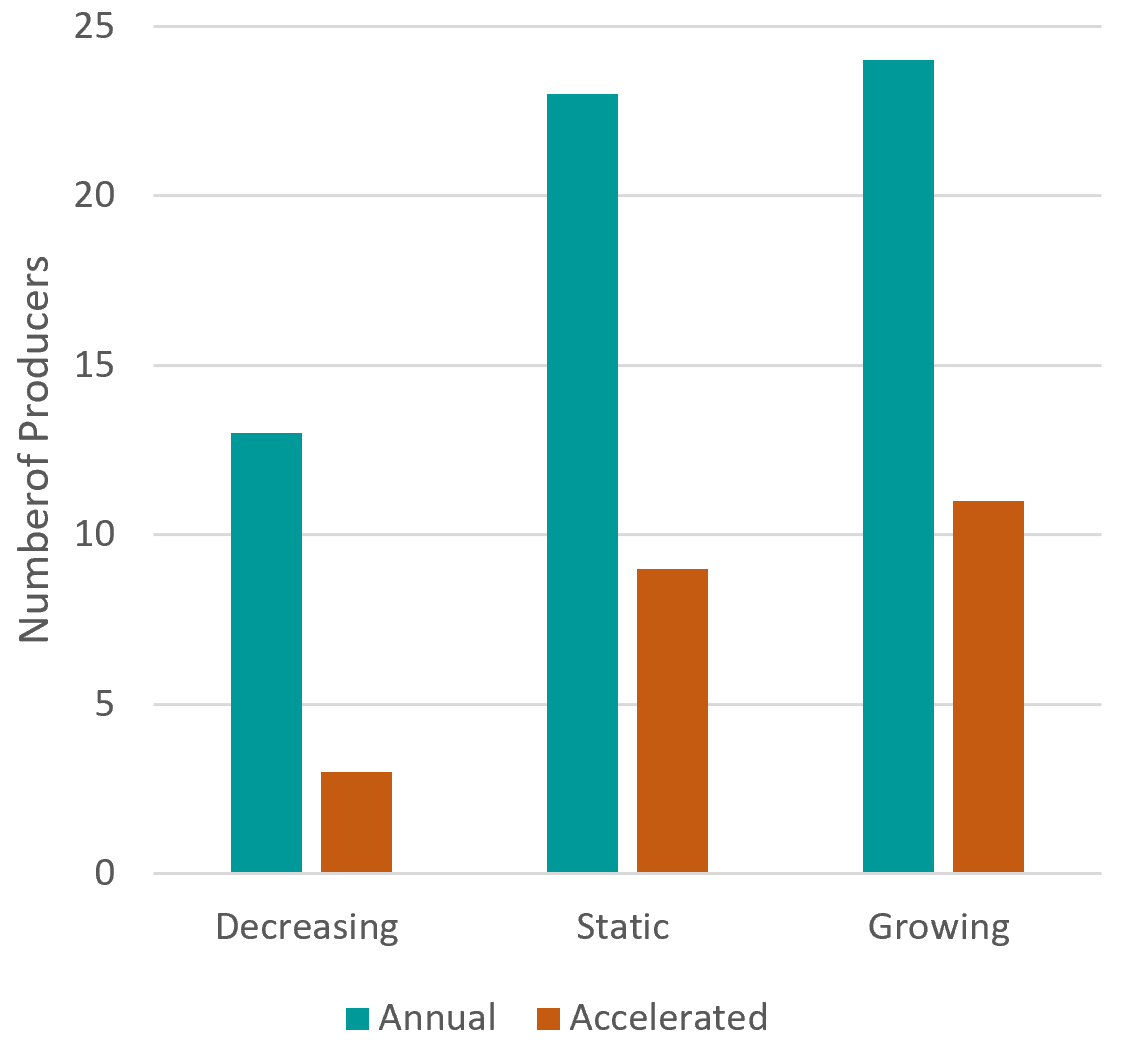
Within the 60 operations reporting annual ewe breeding systems, 24 of those are growing in operation size, 23 are static, and 13 are decreasing. Out of the 23 operations reporting accelerated ewe breeding systems, 11 of those are growing, 9 are static, and 3 are decreasing.
Risk Management Plan Participation
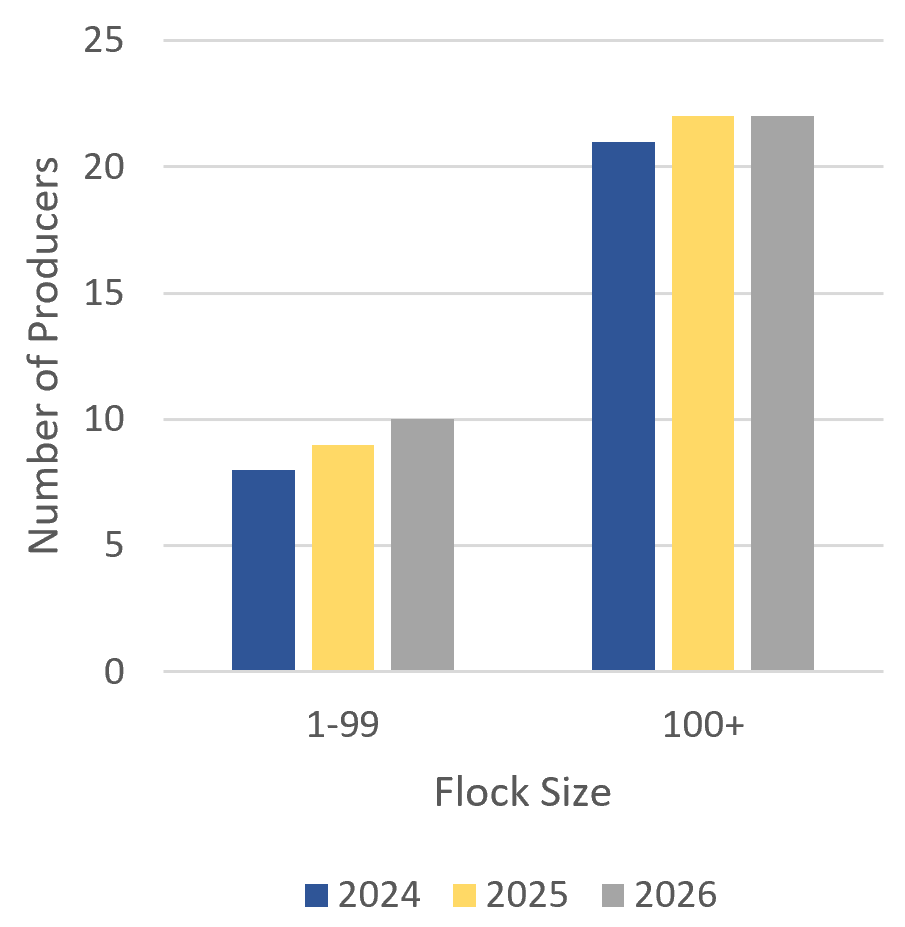
In 2026, 33 producers reported participating in the RMP, an increase from the 30 participants in 2024 (a 10% increase). Participation increased only among producers using annual ewe breeding systems, rising from 15 in 2024 to 17 in 2026, while participation among those using accelerated systems remained unchanged at 15.
1-99 flock size: Participation increased gradually from 8 producers in 2024 to 10 in 2026, representing 20% of producers in this group.
100+ flock size: Participation increased from 21 producers in 2024 to 22 in 2025, with no change in 2026, representing 68.8% of producers in this group.

Operation Type
1-99 flock size: Mixed livestock operations were most common (30%; 15 producers), followed by sheep-only (26%; 13 producers), and sheep and cash crop or mixed livestock and crop operations (20% each; 10 producers each).
100+ flock size: Sheep and cash crop operations were most common (40.6%; 13 producers), followed by sheep-only operations (31.3%; 10 producers), and mixed livestock and crop (9.4%; 3 producers).

Reason for Raising Sheep
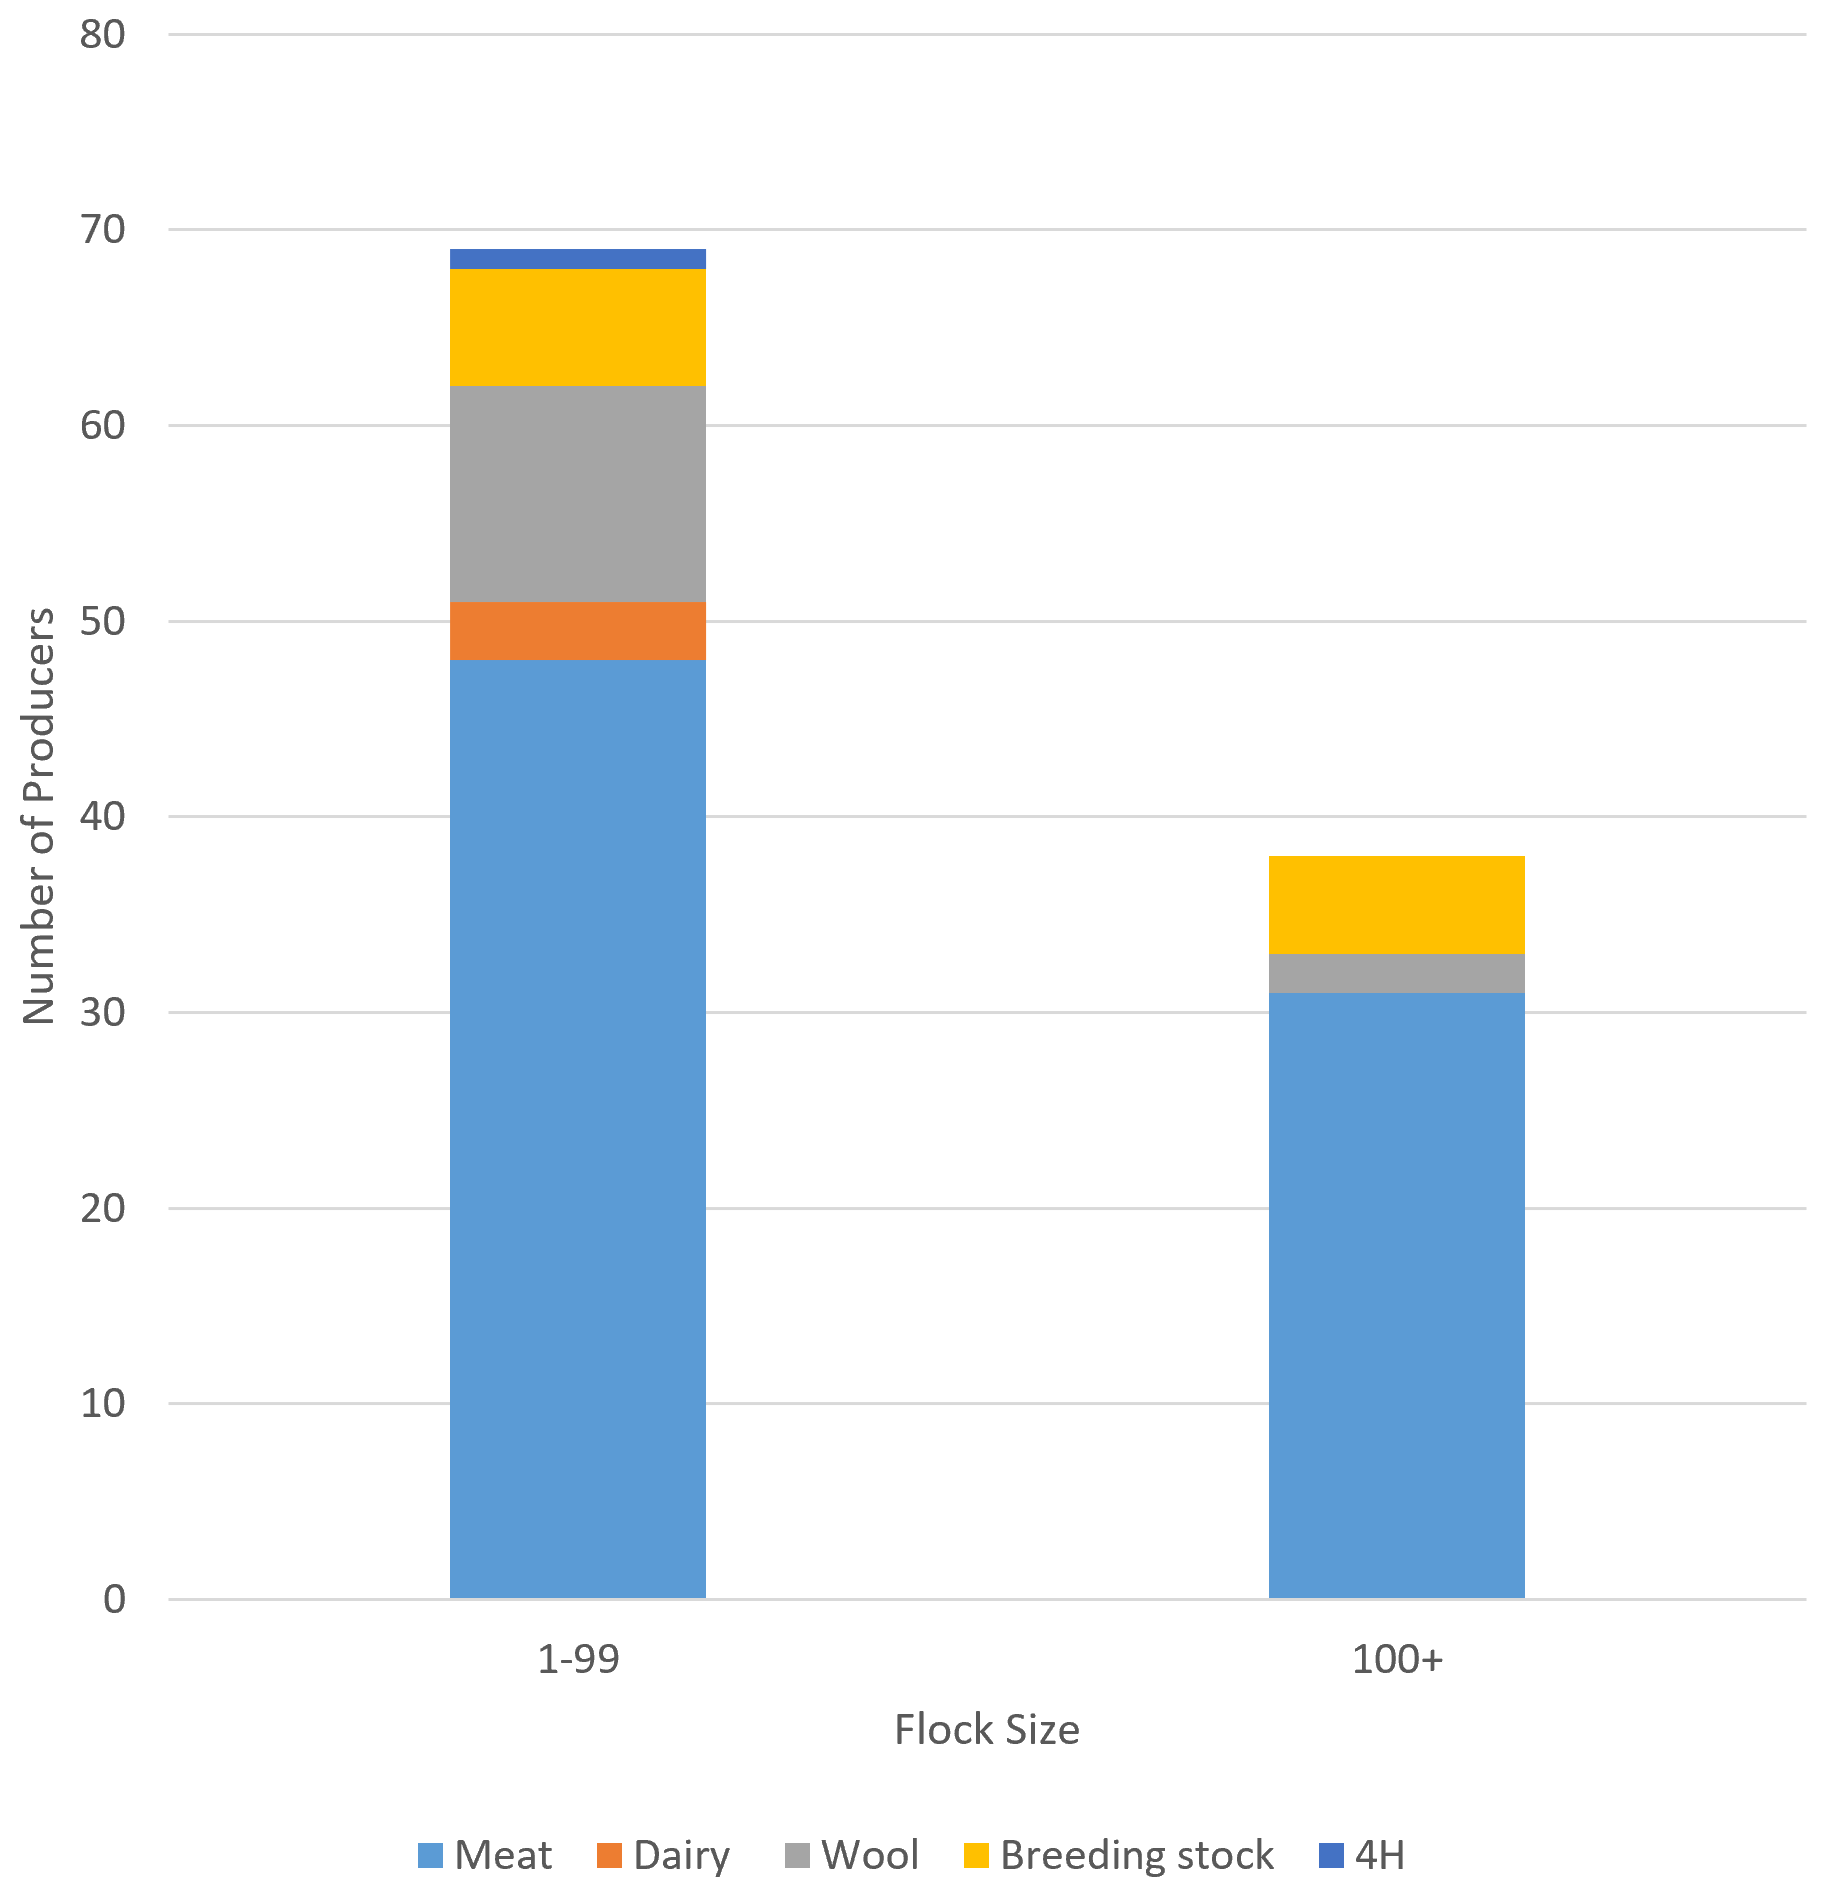
1-99 flock size: Meat production was the primary reason (69.9%; 48 producers), followed by wool (15.9%), breeding stock (8.7%), dairy (4.3%), and 4H (1 producer).
100+ flock size: Meat production was the main reason (81.6%; 31 producers), followed by breeding stock (13.2%), and wool (5.3%). No producers reported dairy production.
Ewe Breeding Systems
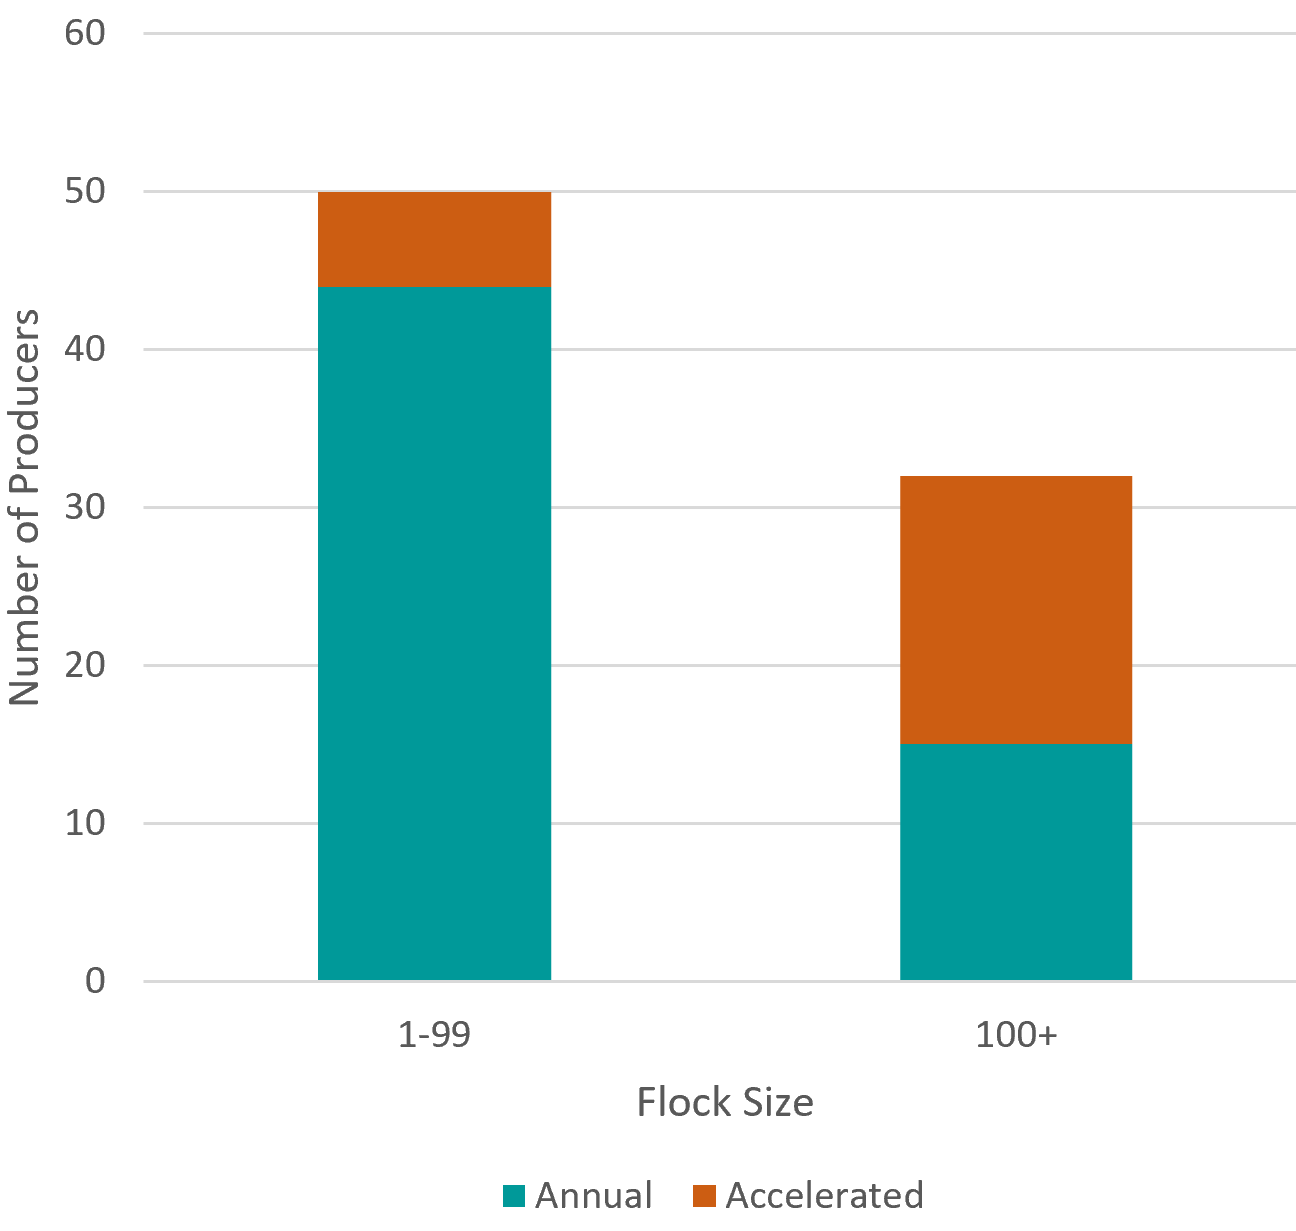
72.3% of respondents (60 producers) had indicated use of annual ewe breeding systems, while 27.7% (23 producers) had indicated use of accelerated breeding systems.
1-99 flock size: 44 producers had indicated an annual breeding system was used, while 6 used accelerated systems.
100+ flock size: 15 producers had indicated an annual system was used, and 17 indicated accelerated system usage.
Lambs bought for further finishing
Among 83 respondents, only 3 reported purchasing lambs for further finishing.
Lambs born per Ewe
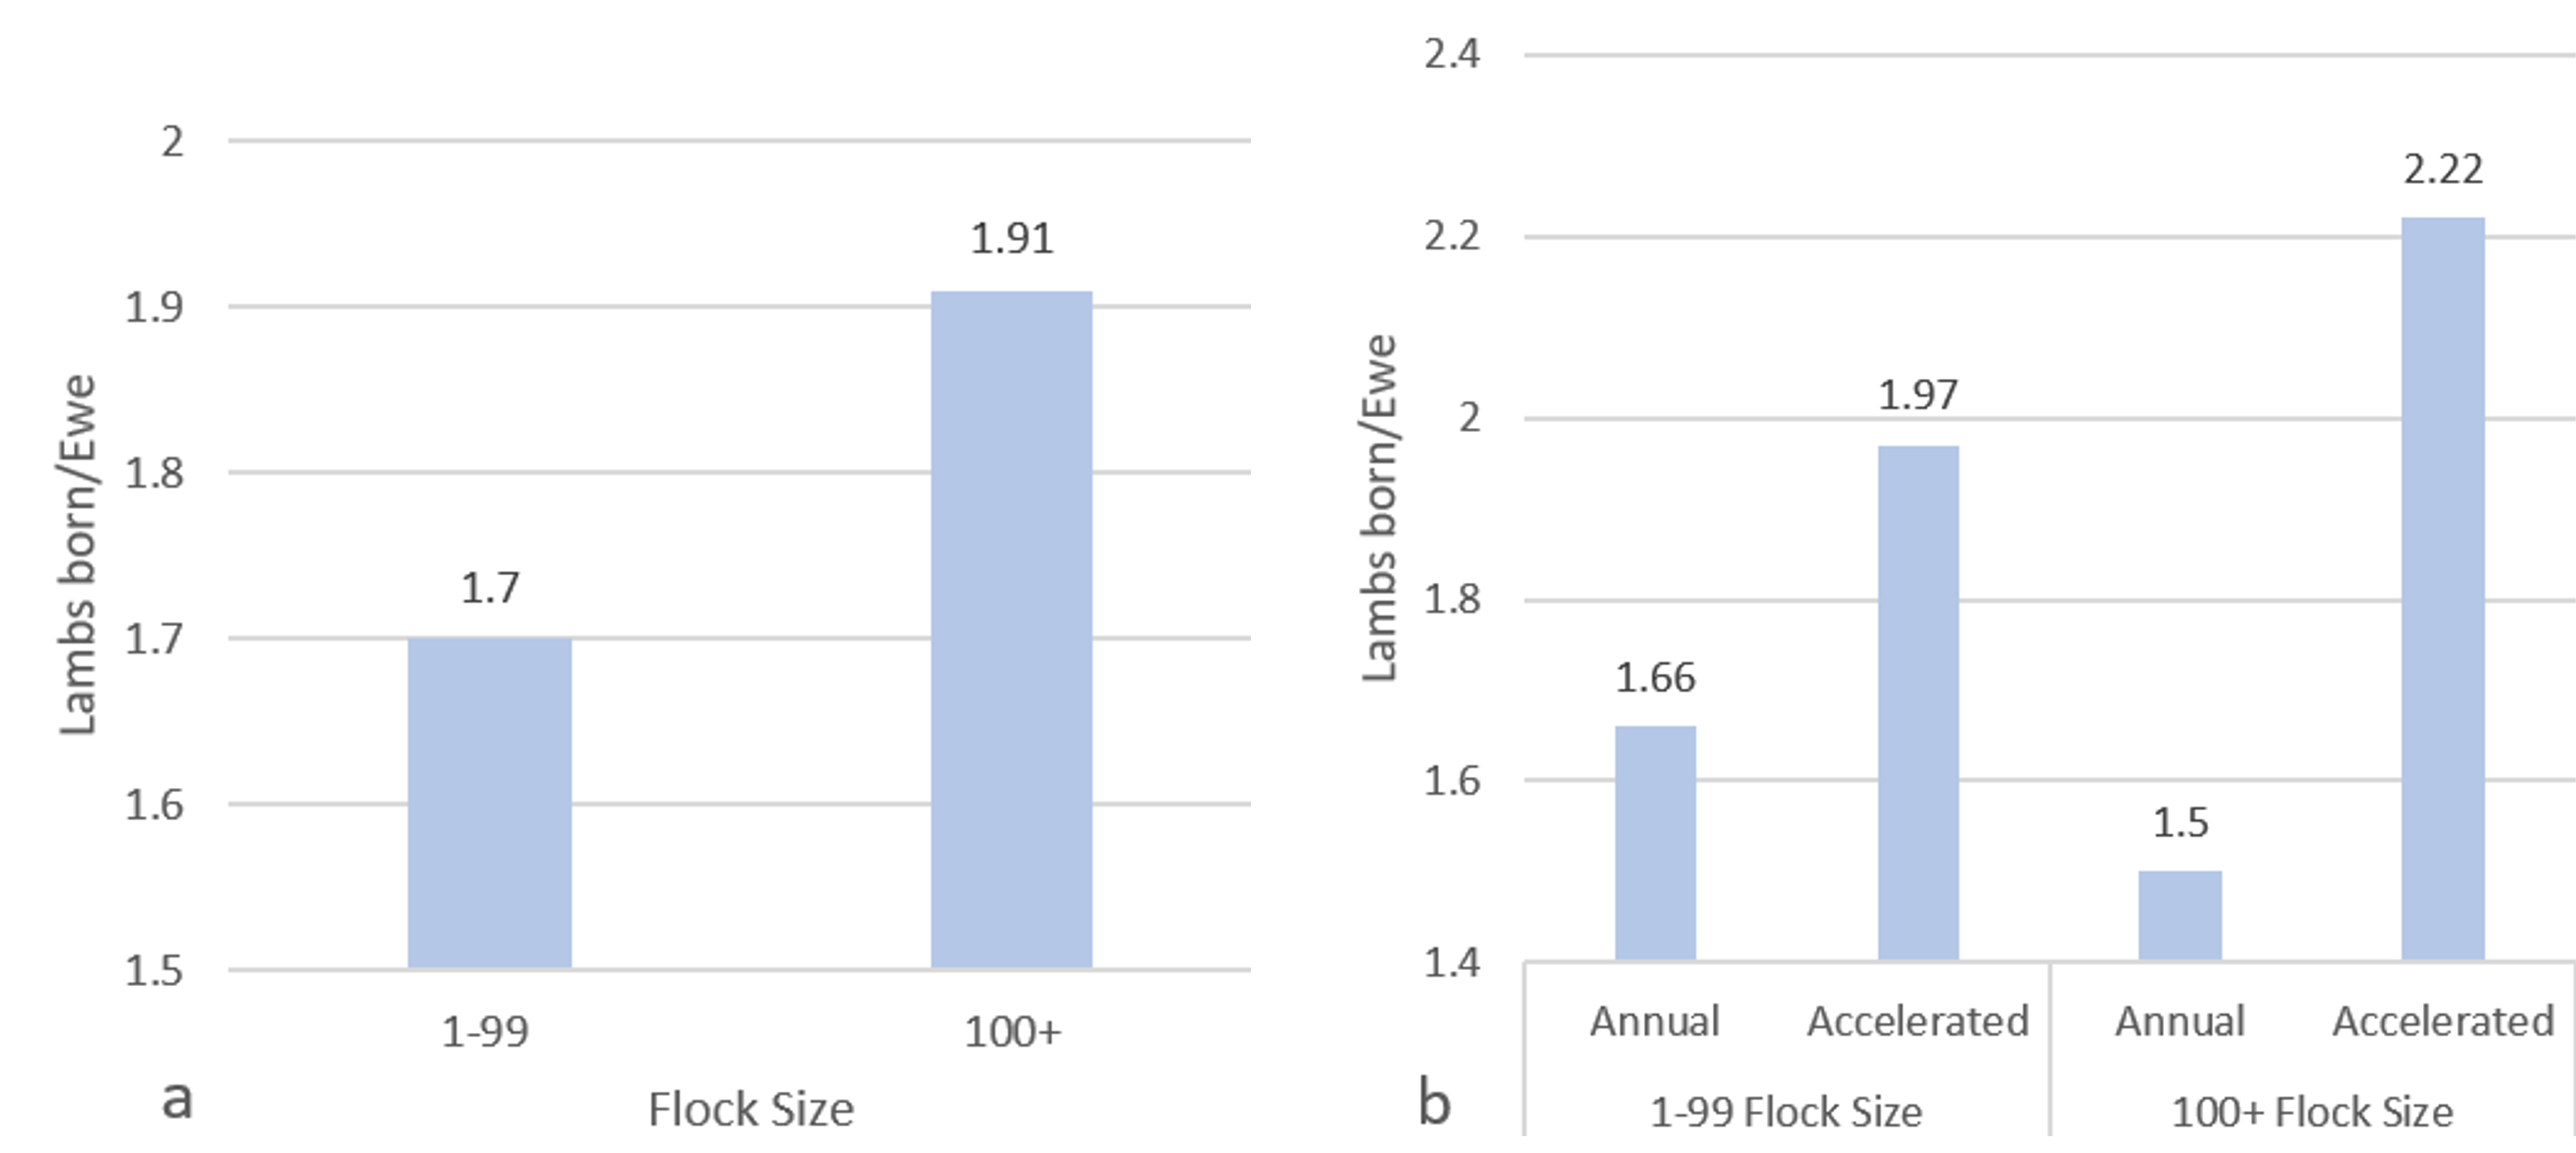
1-99 flock size: Average production was approximately 1.7 lambs per ewe. Accelerated systems averaged 1.97 lambs, compared to 1.66 for annual systems.
100+ flock size: Average production was approximately 1.91 lambs per ewe. Accelerated systems averaged 2.22 lambs, compared to 1.5 for annual systems.
Production System Type (Intensive/Extensive)
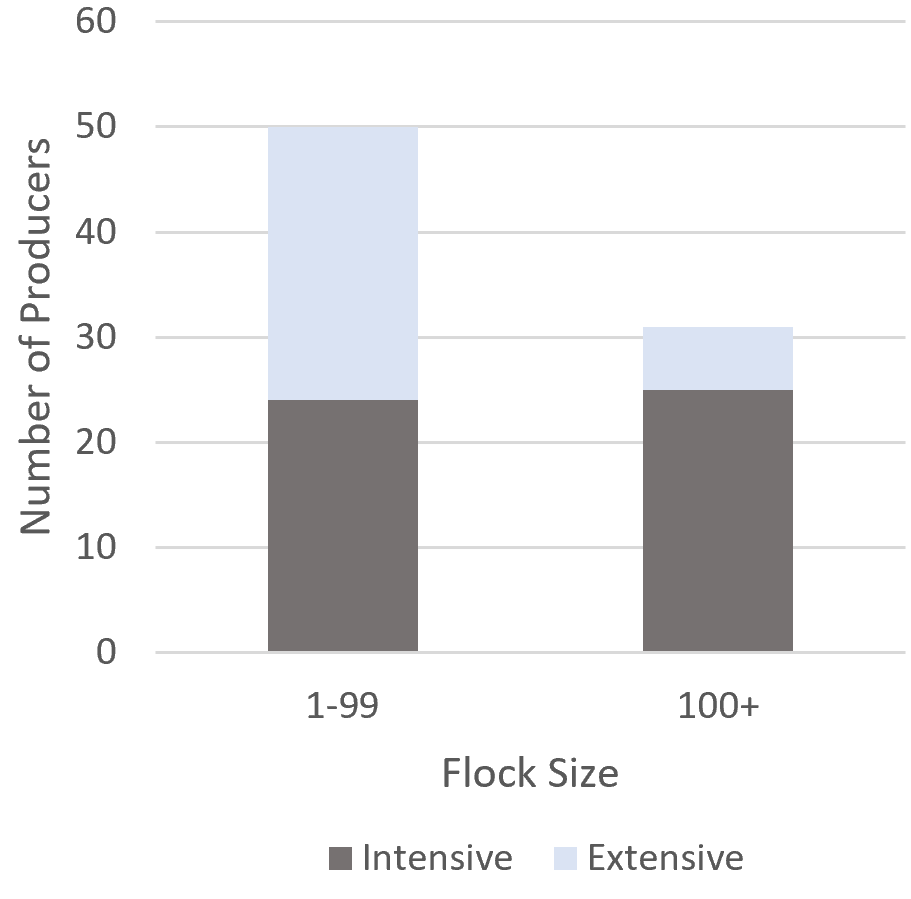
1-99 flock size: 52% of producers had reported an extensive operation (26 producers), while 48% had reported an intensive operation (24 producers).
100+ flock size: 80.6% of producers had reported an intensive operation (25 producers), while only 19.4% had reported an extensive operation (6 producers).
Pasture Usage
Of 83 respondents, 80.7% (67 producers) reported using pasture. Among these, 76.1% (51 producers) used an annual breeding system and 23.9% (16 producers) used an accelerated system. For producers not using pasture (16 producers), 9 had indicated an annual breeding system (56.3%), and 7 used an accelerated breeding system.
1-99 flock size: 88% (44 producers) reported pasture usage, while only 12% (6 producers) did not use pasture.
100+ flock size: 71.9% (23 producers) reported pasture usage, while only 28.1% (9 producers) did not use pasture.

Extended Grazing Usage
Out of 82 surveyed, 63.4% (52 producers) had not used extended grazing strategies, while 36.6% (30 producers) had used extended grazing strategies.
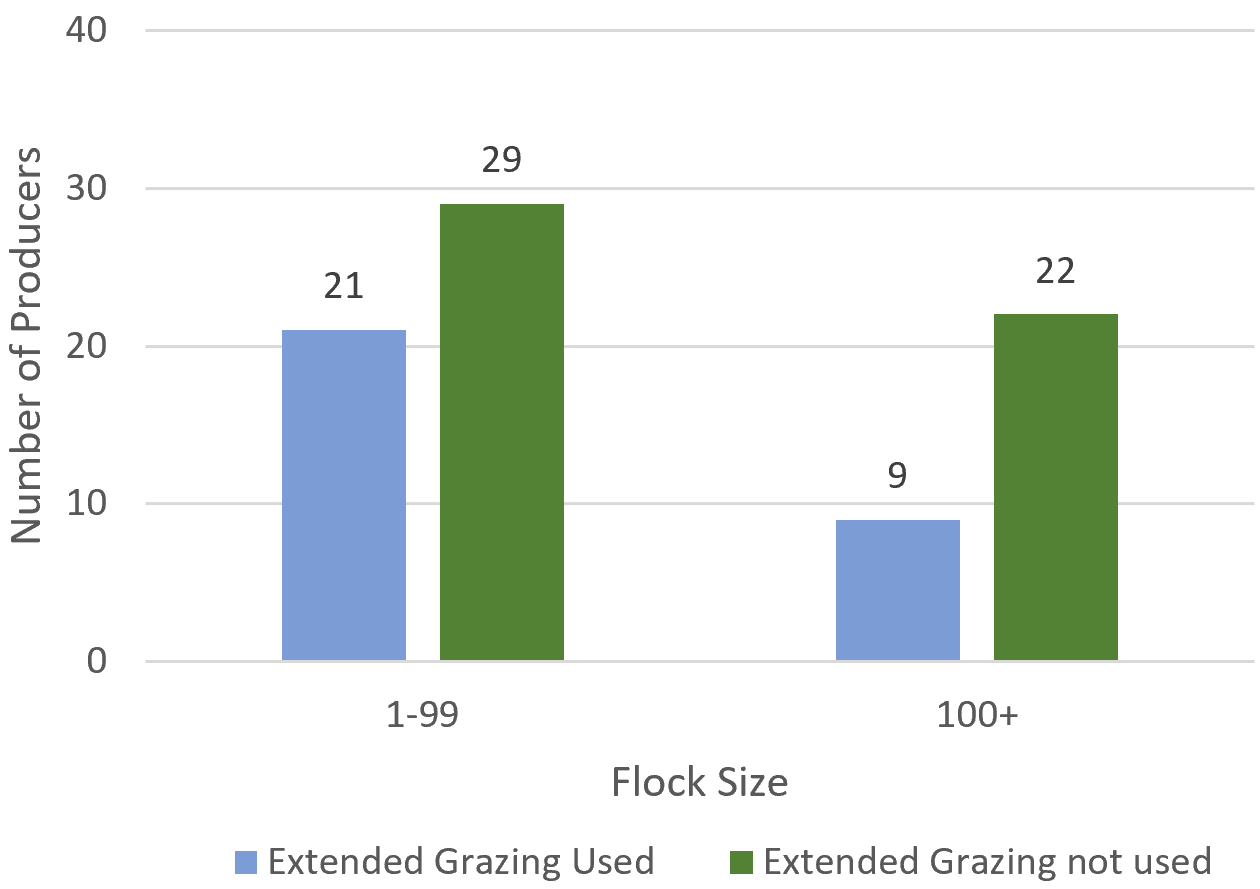
1-99 flock size: 58% (29 producers) had reported no usage of extended grazing strategies, while 42% (21 producers) had used these strategies.
100+ flock size: 71% (22 producers) had reported no usage of extended grazing strategies, while 29% (9 producers) had used these strategies.
Feed Crops and Hay Grown for Sheep Operation
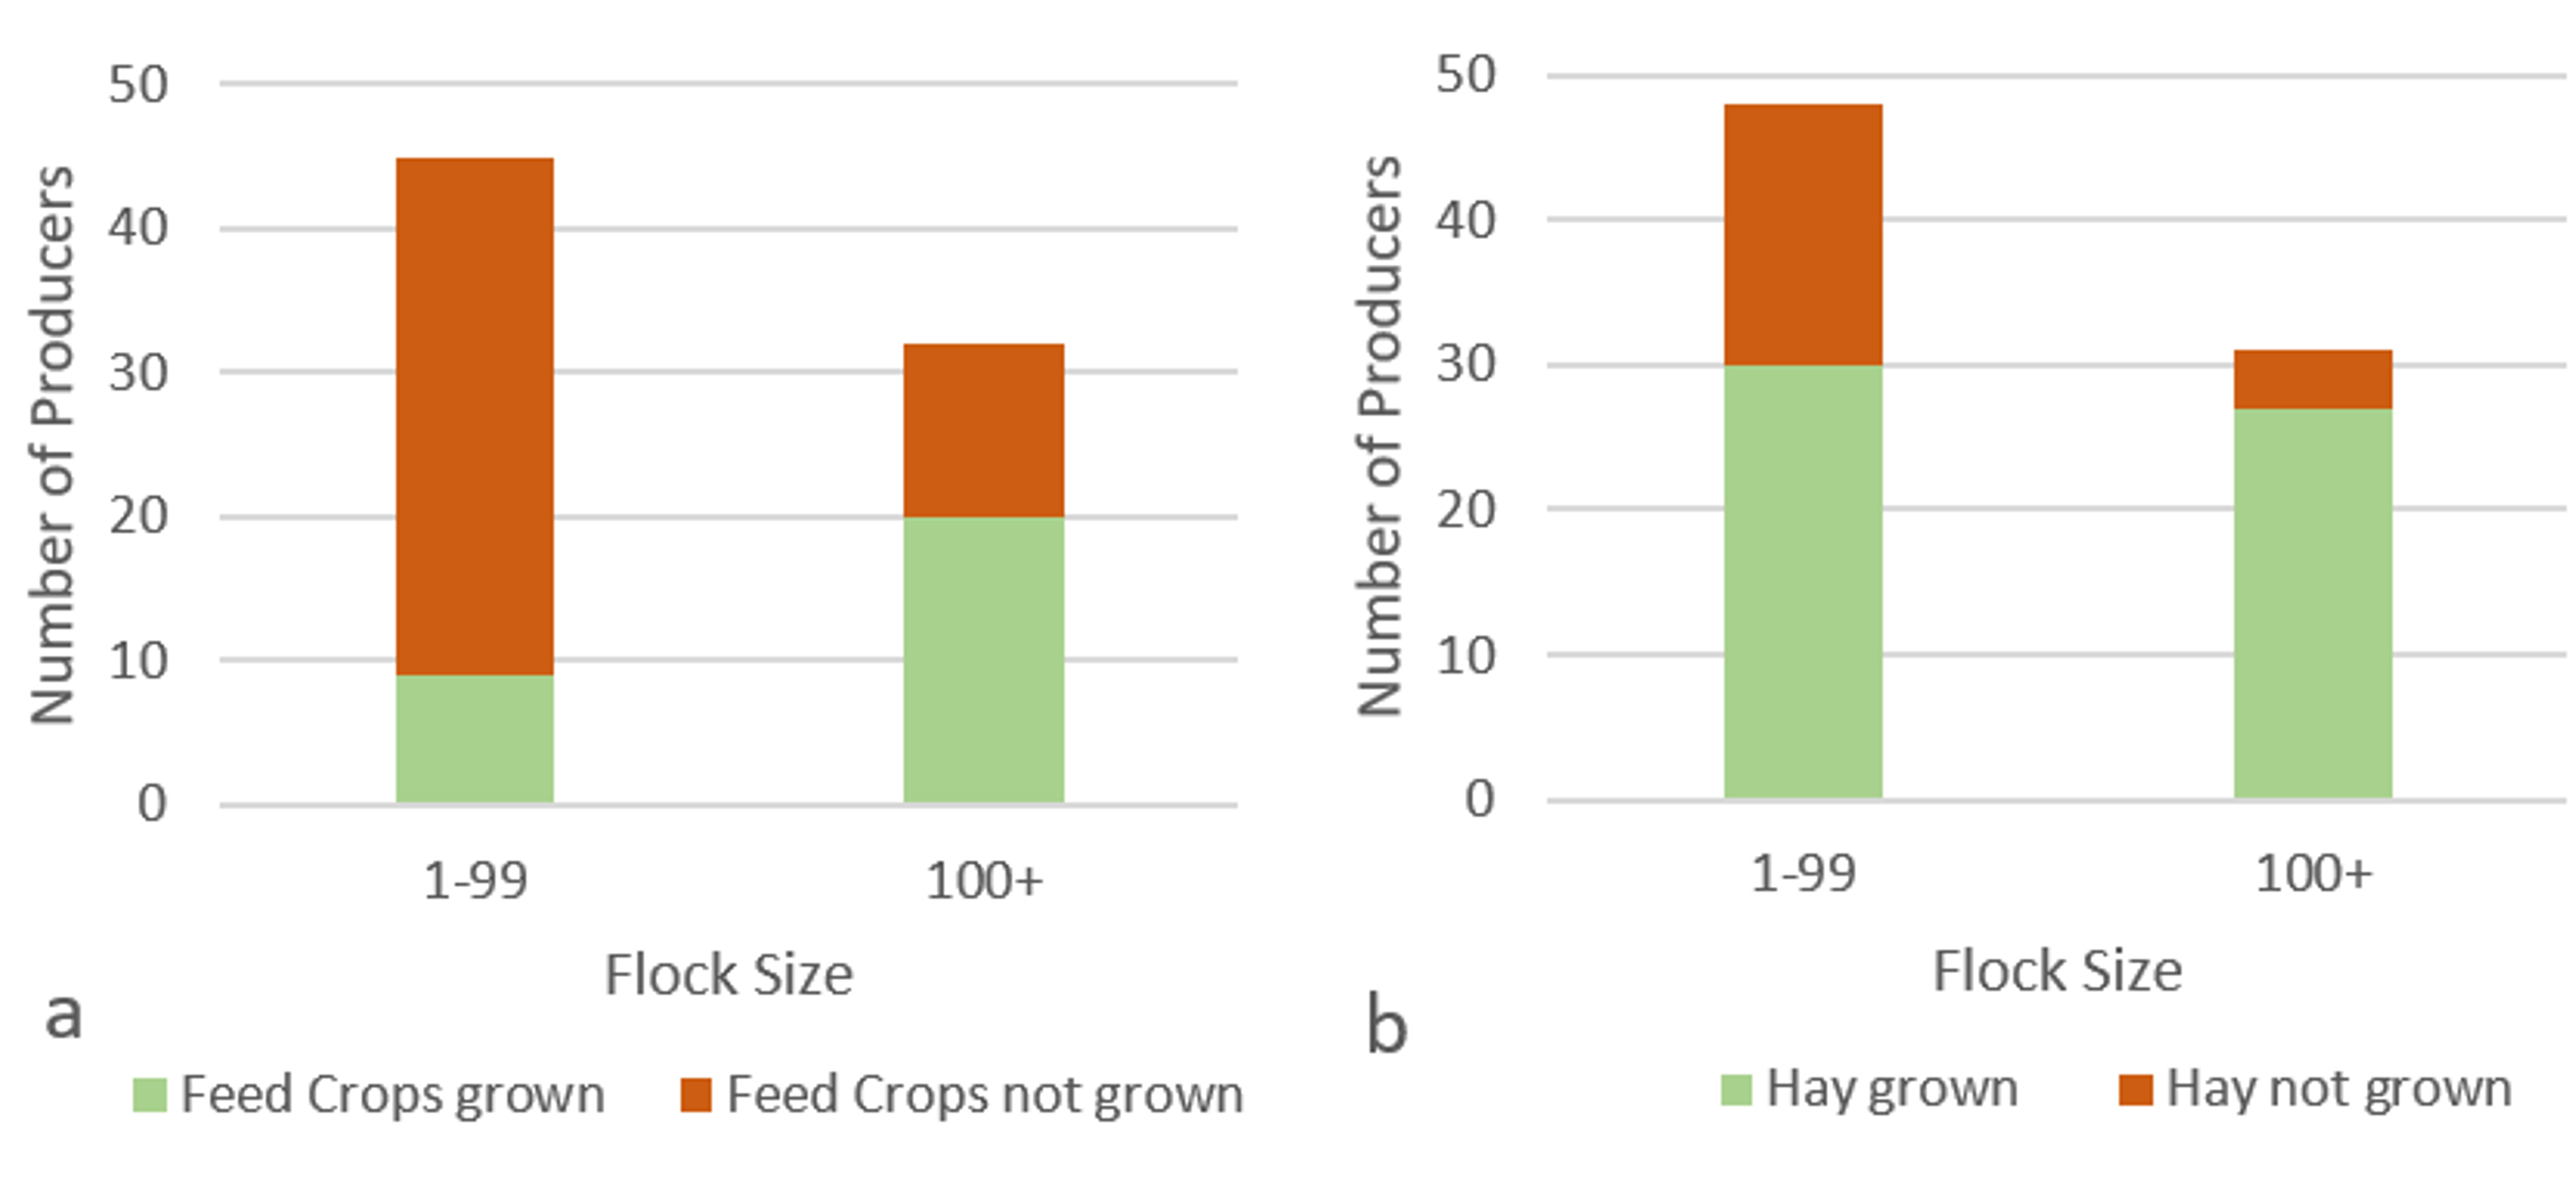
Of the 78 respondents, only 38.5% (30 producers) had reported they had grown feed crops in 2025, while 61.5% (48 producers) had not grown feed crops. Of the 80 respondents, 72.5% (58 producers) had reported they had grown hay, while 27.5% (22 producers) had indicated not growing hay.
1-99 flock size: 80% (36 producers) had reported not growing feed crops, while only 20% (9 producers) had indicated they grew feed crops. 62.5% (30 producers) had reported growing hay, while 37.5% (18 producers) had indicated not growing hay.
100+ flock size: 62.5% (20 producers) had reported growing feed crops, while 37.5% (12 producers) had reported not growing feed crops. 87.1% (27 producers) had reported growing hay, while only 12.9% (4 producers) had indicated not growing hay.
Forage and Grain Purchased for Sheep Operation
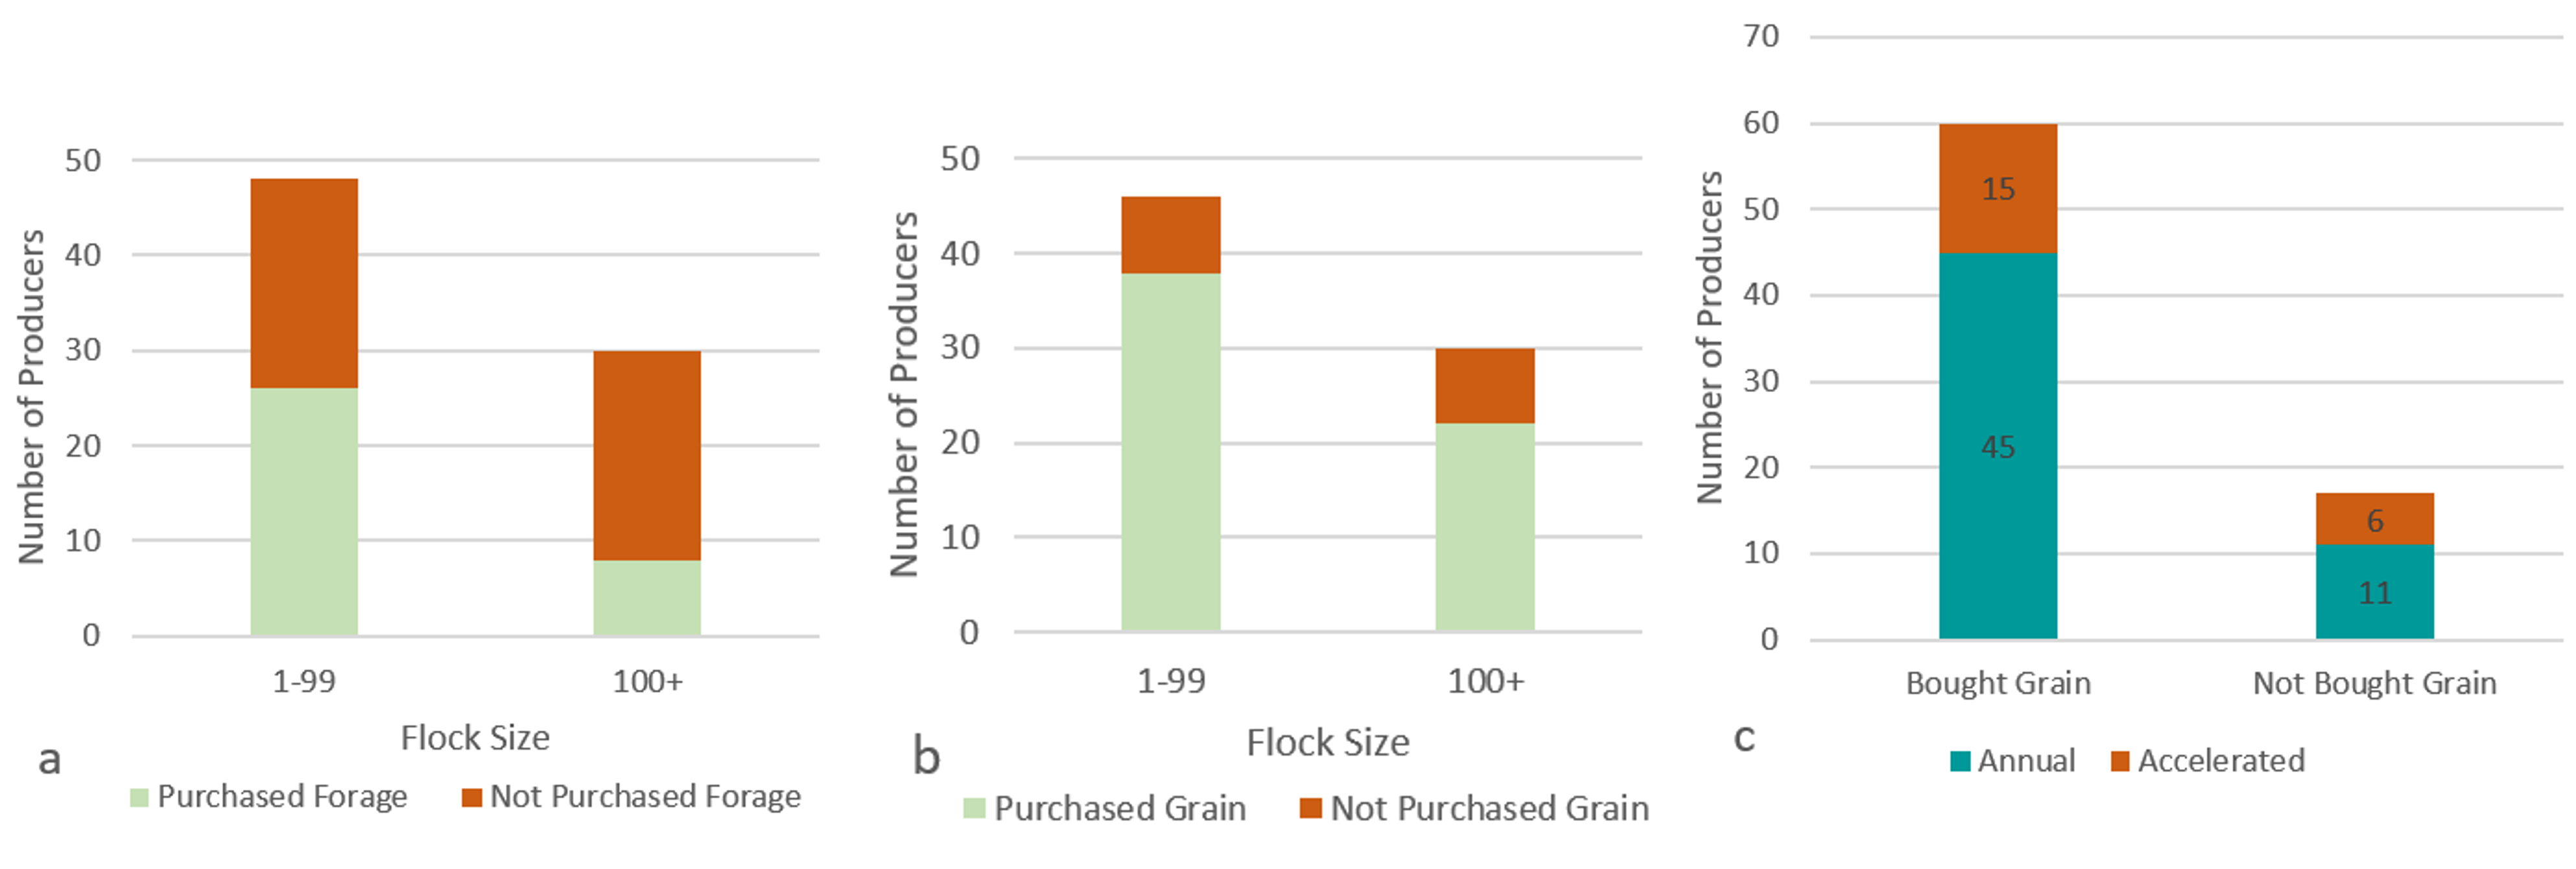
Of the 79 respondents, only 44.3% (35 producers) had reported they had purchased forage in 2025, while 55.7% (44 producers) had not purchased forage. Of the 77 respondents, 77.9% (60 producers) had reported purchasing grain, while 22.1% (17 producers) had indicated not purchasing grain. Of those who purchased grain, 75% (45 producers) had bred their ewes on an annual program, and 25% (15 producers) used an accelerated system. For those that did not purchase grain, 64.7% (11 producers) had bred their ewes on an annual program, and 35.3% (6 producers) used an accelerated system.
1-99 flock size: 54.2% (26 producers) had reported purchasing forage, while 45.8% (22 producers) had not purchased forage. 82.6% (38 producers) had reported purchasing grain, while only 17.4% (8 producers) had reported not purchasing grain.
100+ flock size: 73.3% (22 producers) had reported not purchasing forage, while 26.7% (8 producers) had purchased forage. 73.3% (22 producers) had purchased grain, while 26.7% (8 producers) had not purchased grain.
Future Flock Improvement
1-99 flock size: Most producers have listed ewe nutrition (22 producers) as the area of their flock production that they would most like to improve. Also listed at high importance were labor and time management (21 producers), pasture management (19 producers), marketing and record keeping (18 producers each), followed by financial planning (17 producers) and other various flock improvement areas.
100+ flock size: Lamb mortality and labor and time management both make up the largest shares (20 producers each), followed by business management (13 producers), and genetics (12 producers).
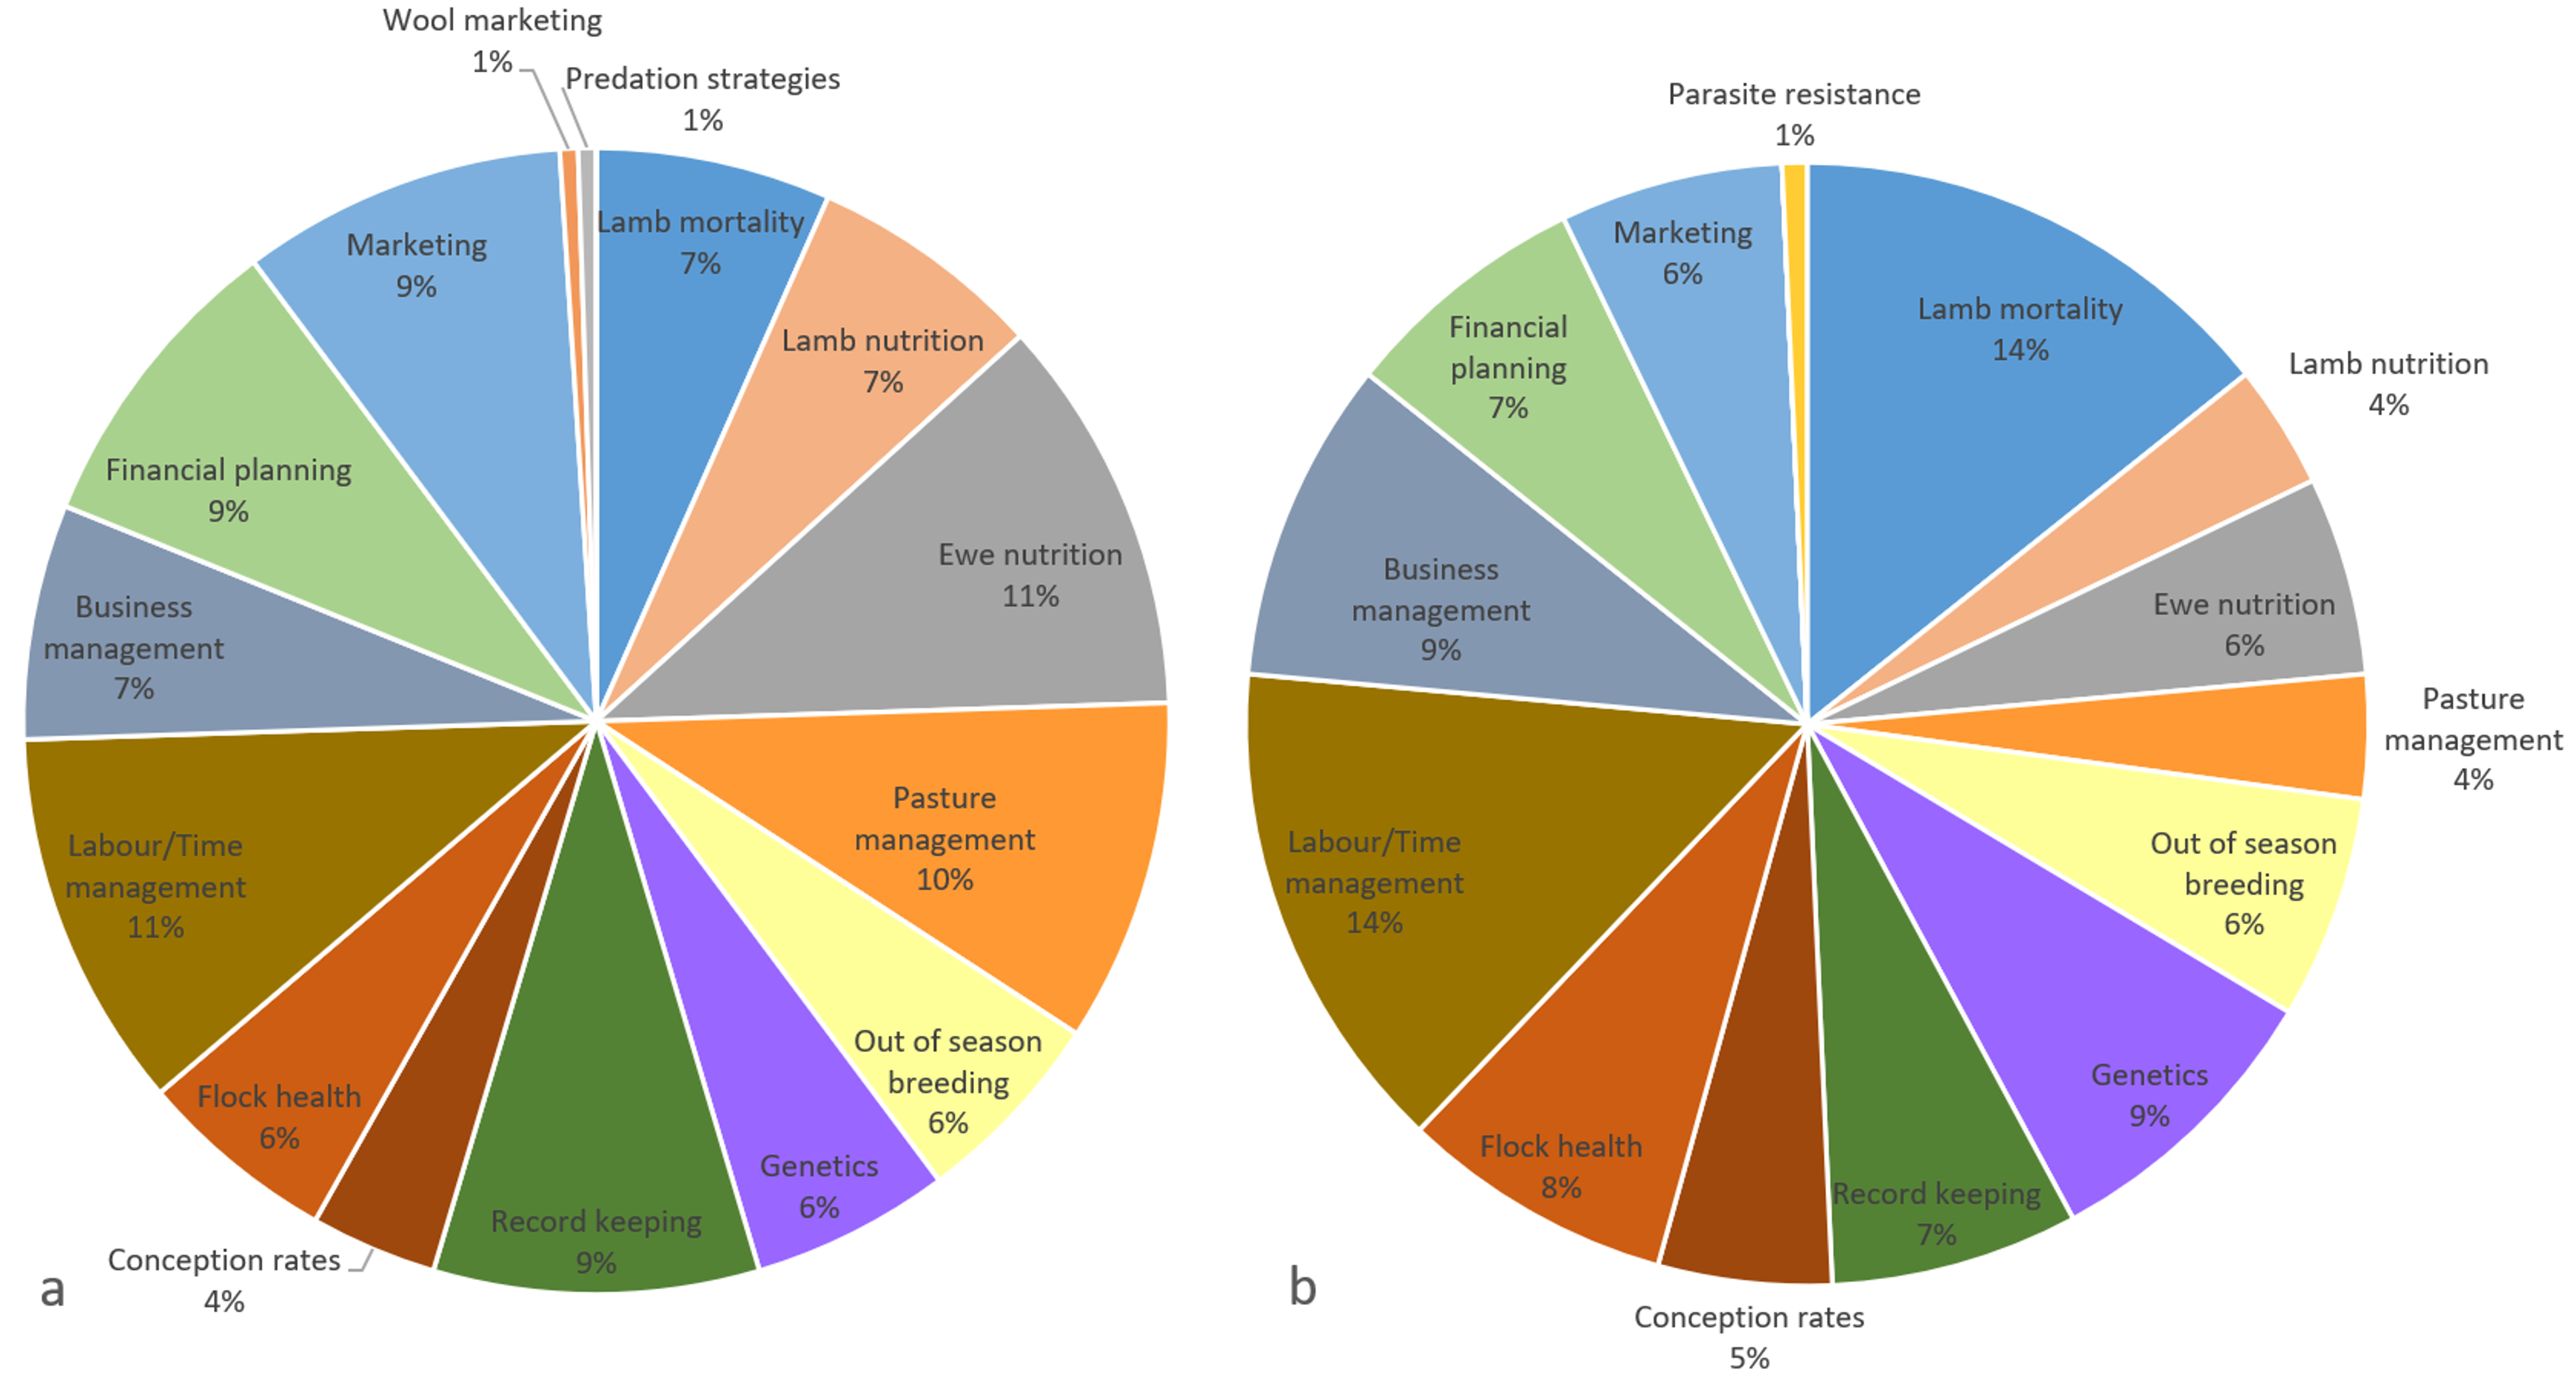
| Flock Size | Lamb mortality | Lamb nutrition | Ewe nutrition | Pasture management | Out of season breeding | Genetics | Record keeping | Conception rates | Flock health | Labor/Time management | Business management | Financial planning | Marketing | Wool marketing | Predation strategies | Parasite resistance |
| 1-49 | 6 | 10 | 17 | 16 | 7 | 8 | 15 | 5 | 7 | 17 | 12 | 15 | 16 | 1 | 0 | 0 |
| 50-99 | 7 | 3 | 5 | 3 | 4 | 3 | 3 | 2 | 4 | 4 | 1 | 2 | 2 | 0 | 1 | 0 |
| 100-149 | 4 | 2 | 2 | 0 | 2 | 2 | 2 | 1 | 4 | 6 | 2 | 3 | 3 | 0 | 0 | 0 |
| 150-199 | 4 | 2 | 5 | 2 | 1 | 3 | 4 | 2 | 3 | 6 | 5 | 4 | 3 | 0 | 0 | 0 |
| 200-249 | 2 | 0 | 0 | 1 | 2 | 1 | 0 | 1 | 0 | 1 | 1 | 1 | 0 | 0 | 0 | 0 |
| >250 | 10 | 1 | 1 | 2 | 4 | 6 | 4 | 3 | 4 | 7 | 5 | 2 | 3 | 0 | 0 | 1 |
| Total | 33 | 18 | 30 | 24 | 20 | 23 | 28 | 14 | 22 | 41 | 26 | 27 | 27 | 1 | 1 | 1 |
Interest in Variable Costs Project
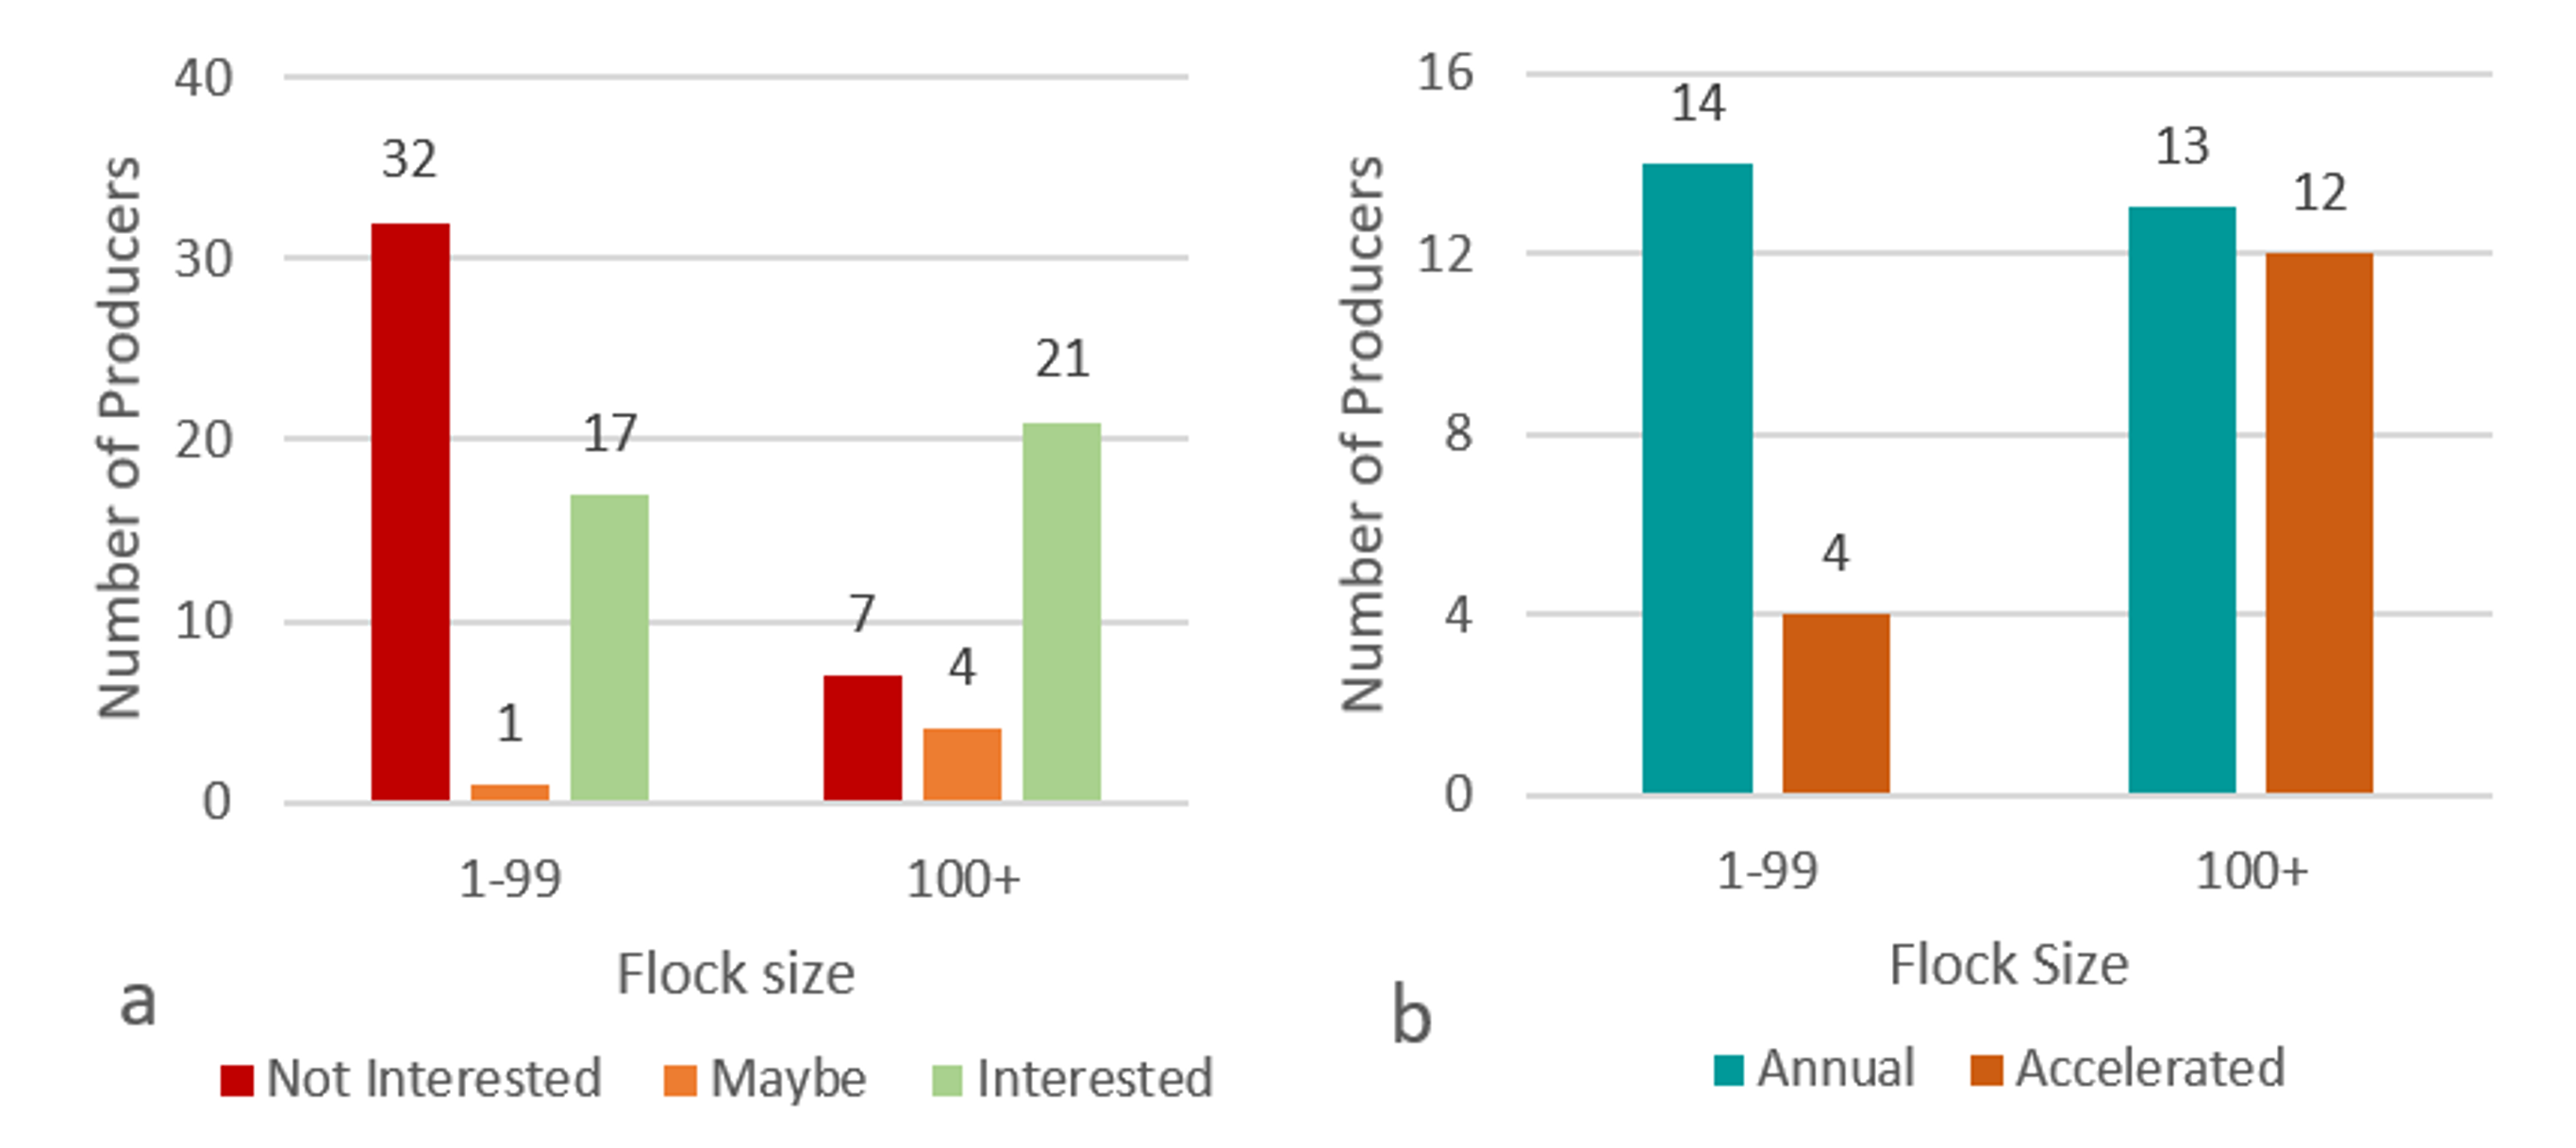
1-99 flock size: 32 producers had indicated no interest in participating in this project, while 18 had indicated they would like to participate to some degree. Of those interested, 14 producers had bred their ewes annually, and 4 bred using an accelerated system.
100+ flock size: 25 producers had indicated they were interested in participating in this project, while 7 had no interest in participating. Of those interested, there was an almost even split between the ewe breeding system used, with 13 breeding annually and 12 breeding using an accelerated system.