This article was written by Kristy Blankers and Delma Kennedy.
Overview
The goat industry has seen steady growth over the past decade, especially in Ontario. The dairy sector has seen a consistent increase in the volume of milk produced. The meat sector has had a gradual increase in animals sold in live auctions and number of animals slaughtered into 2023 and remained steady in 2024. Meat prices saw a significant increase in the first half of 2025 before returning to 2024 price levels in July.
Inventory
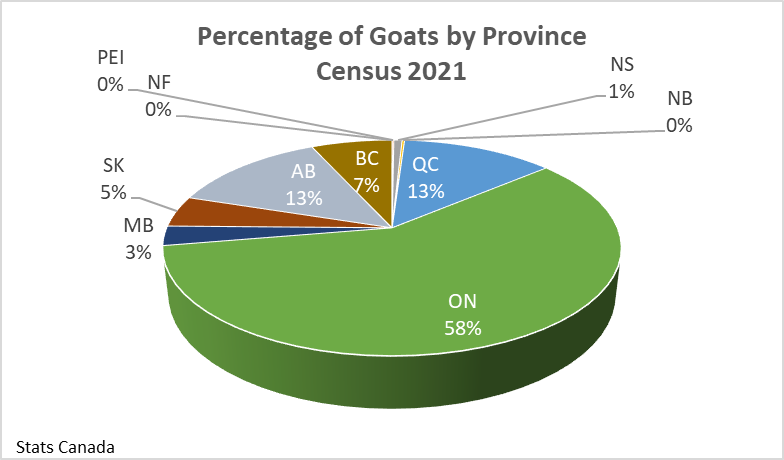
Goat inventory data is only collected through the Canadian census. The last census was conducted in 2021. With 58% of the total goats in Canada, Ontario has the largest share of the goat inventory. Alberta and Quebec both have the second largest percentage of goats at 13%. Figure 1 shows the percentage of goats by province in 2021.
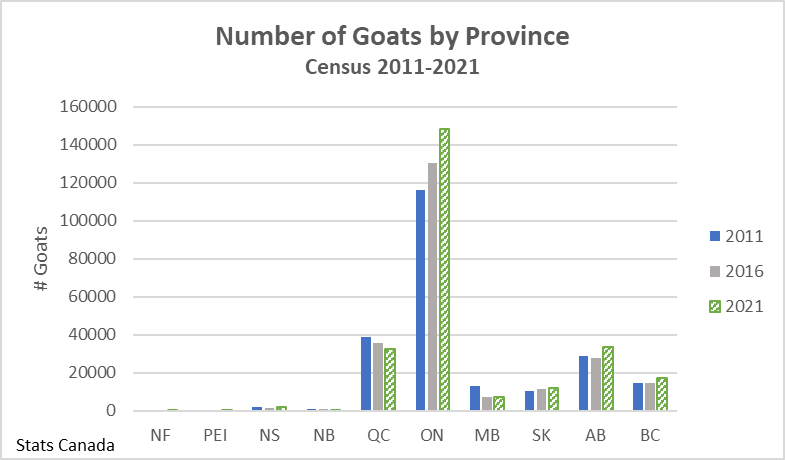
The number of goats in Canada increased by 12.3% from 2011 to 2021, with the Ontario goat population growing by 27.4% over this period. Figure 2 shows the number of goats by province for the past 3 census counts. This figure illustrates that most of the Canadian growth happened in Ontario with some growth in the western provinces and a decrease in numbers in provinces east of Ontario.
The number of goat farms has decreased or remained stable in all provinces, as seen in figure 3. It is important to note that figure 3 shows all farms reporting goats, not goat farms. The decreased number of farms with goats and the increased number of goats has resulted in a Canadian average of 52.8 goats per farm in 2021 compared to 37.9 goats per farm in 2011.

The Dairy Industry
In 2024 there were 194 licensed goat milk farms in Ontario. The number of farms peaked in 2017 at 290. Figure 4 shows that farm numbers have been decreasing steadily since 2017.
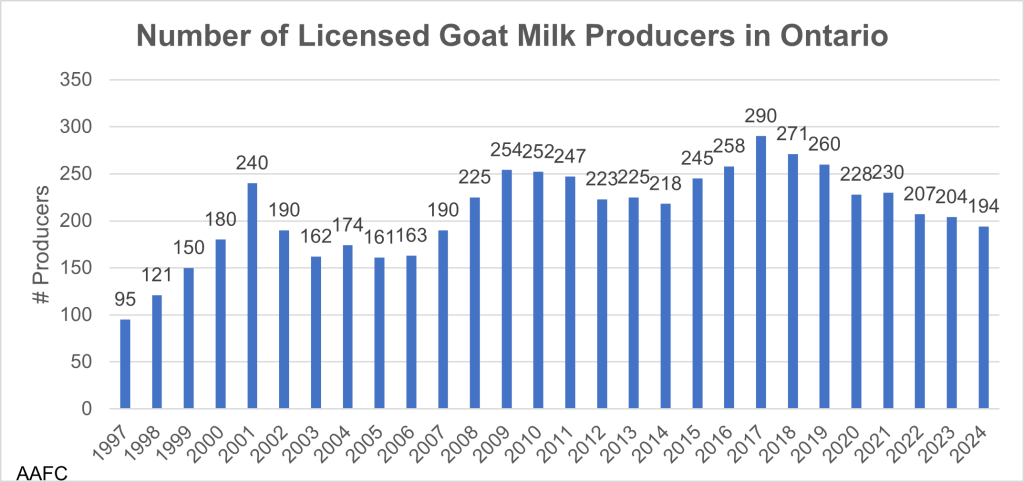
Figure 5 shows the estimated milk production in Ontario and Quebec. Milk production in Ontario has steadily increased since 2017, while production in Quebec has been slowly decreasing. In 2024, Ontario produced 89.8% of the goat milk in Canada. Ontario had a 60% increase in milk production from 2014 to 2024.
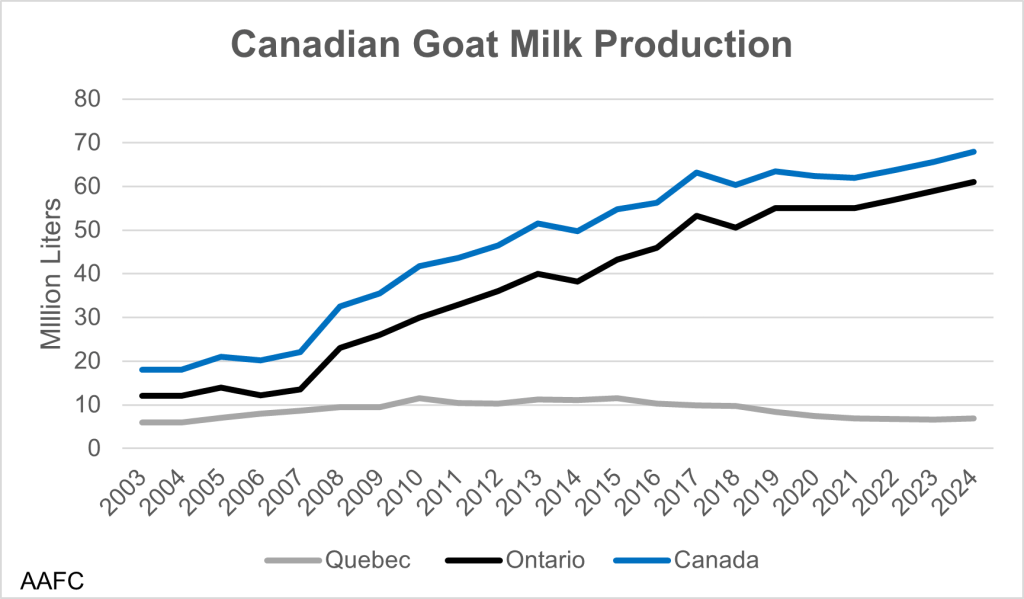
Figure 5. Estimate milk production (in millions of litres) in Ontario and Quebec. Source: Agriculture and Agri-Food Canada.
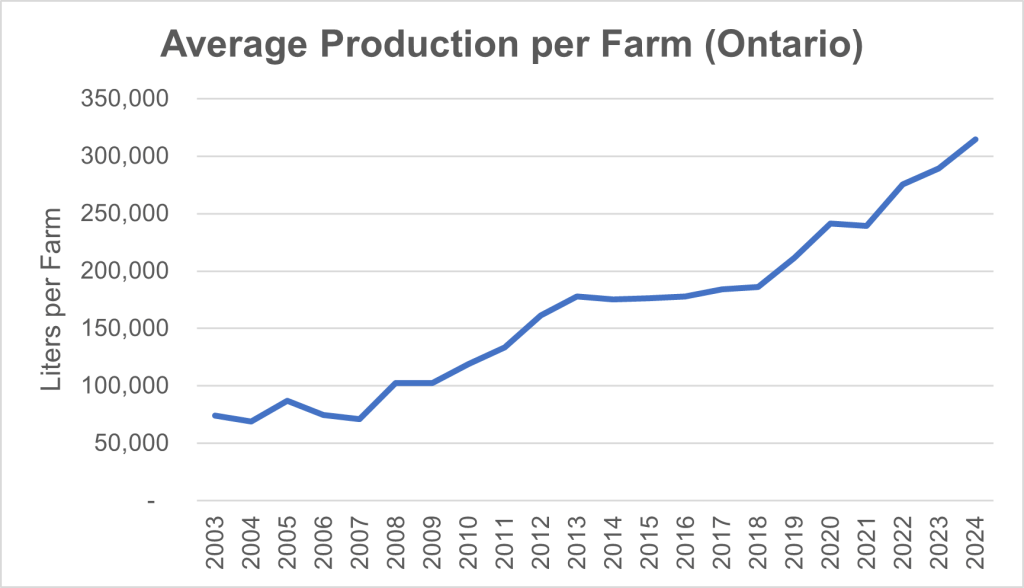
The consistent milk supply and decrease in farm numbers since 2017 in Ontario indicate an increase in average milk production per farm (Figure 6). The average volume of milk produced per farm per year in Ontario has increased by 71.1% from 184,000 litres in 2017 to 314,000 litres in 2024.
Producer Demographics
As seen in figure 7, dairy goat operators are, on average, younger than other farm operators. In 2021, the average age of a dairy goat operator was 44.8 years of age, up from an average of 42.8 years in 2016. Whereas the average age of farm operators in Canada was 56 years of age in 2021.

Cheese Imports and Exports
Figure 8 shows the imports of soft goat cheese. Soft goat cheese is the only imported cheese type identified as a goat cheese by the Canadian Dairy Information Center. Imports increased by 94.2% between 2019 and 2021, and have started to slowly decrease, with a 21.9% decrease between 2021 and 2024.
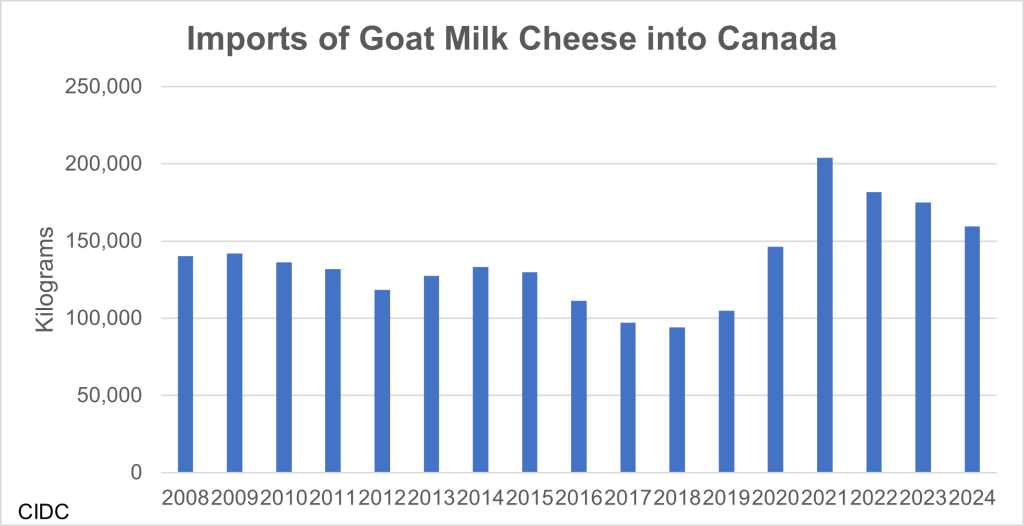
Table 1 shows the volume of imports of the reported goat cheese as well as cheeses that are often made with goat milk.
| Selected Natural and Fresh Canadian Cheese Varieties Import Volumes | |||||
| Year | Goat | Feta | Crontonese | Ricotta | Romano |
| 2014 | 133,185 | 900,815 | 55,933 | 6,990 | 108,466 |
| 2015 | 129,762 | 817,727 | 46,161 | 3,998 | 102,289 |
| 2016 | 111,439 | 812,570 | 15,730 | 10,080 | 74,059 |
| 2017 | 97,052 | 805,426 | 14,183 | 14,479 | 136,448 |
| 2018 | 94,284 | 1,045,590 | 68,356 | 11,398 | 191,900 |
| 2019 | 146,276 | 1,039,162 | 22,874 | 15,038 | 71,559 |
| 2020 | 105,050 | 1,128,320 | 26,714 | 16,816 | 98,236 |
| 2021 | 204,043 | 1,371,738 | 17,582 | 19,456 | 66,495 |
| 2022 | 181,766 | 1,363,985 | 19,816 | 32,016 | 67,839 |
| 2023 | 175,065 | 1,605,467 | 16,919 | 25,413 | 61,622 |
| 2024 | 159,395 | 1,794,938 | 17,234 | 45,896 | 33,541 |
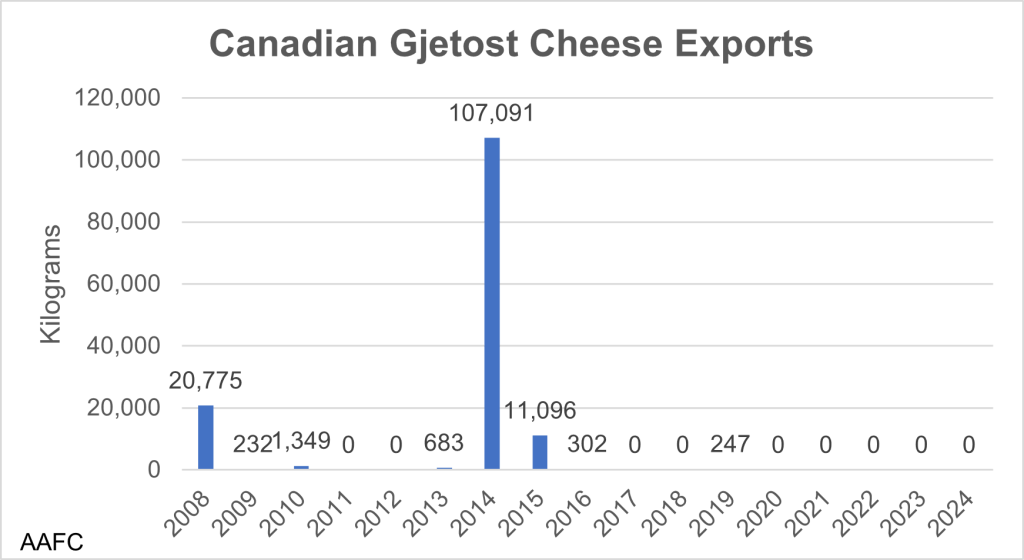
Gjetost cheese is the only type of goat cheese with available export information. Export quantities have been erratic, with no Gjetost exports since 2019 as shown in figure 9.
The Meat Industry
Slaughter
Goat slaughter in Ontario primarily occurs in provincially inspected plants, with less than 1% of goats being slaughtered in federal plants. Goat slaughter numbers increased from 2016 to 2023 and held steady in 2024, as seen in figure 10. This increase occurred in provincial plants, with little goat slaughter done in federal plants.

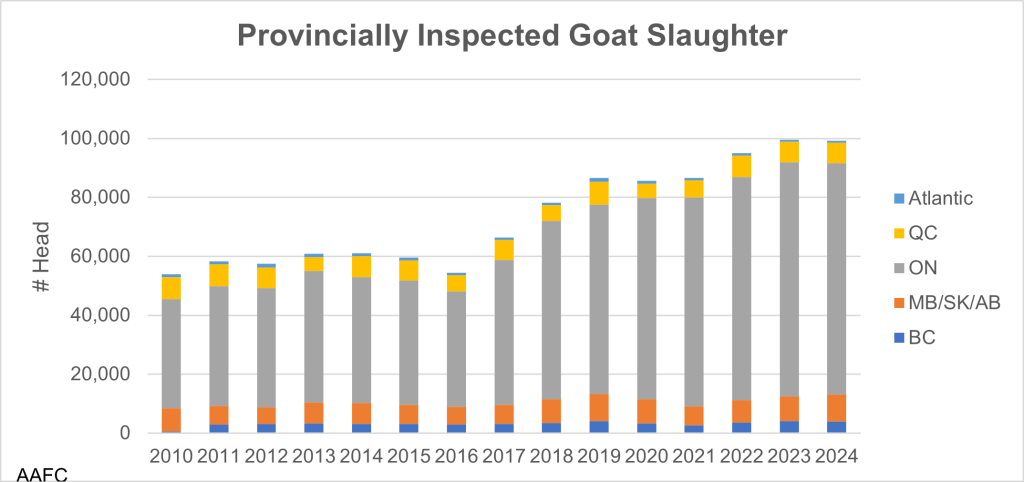
Figure 11 shows the number of goats slaughter in provincial plants across Canada. In 2024, 79.2% of goats slaughtered in provincial plants were in Ontario. This means that Ontario consumes approximately 79.2% of the Canadian goat meat, since provincially inspected meat cannot be moved between provinces.
Live Market Volume Price
Figure 12 shows the number of kids and goats sold at live auctions since 2010 in Ontario. Since 2019 there has been a 17.4% increase in the number of kids sold and a decrease of 22.3% in the number of goats sold at live auctions in Ontario.
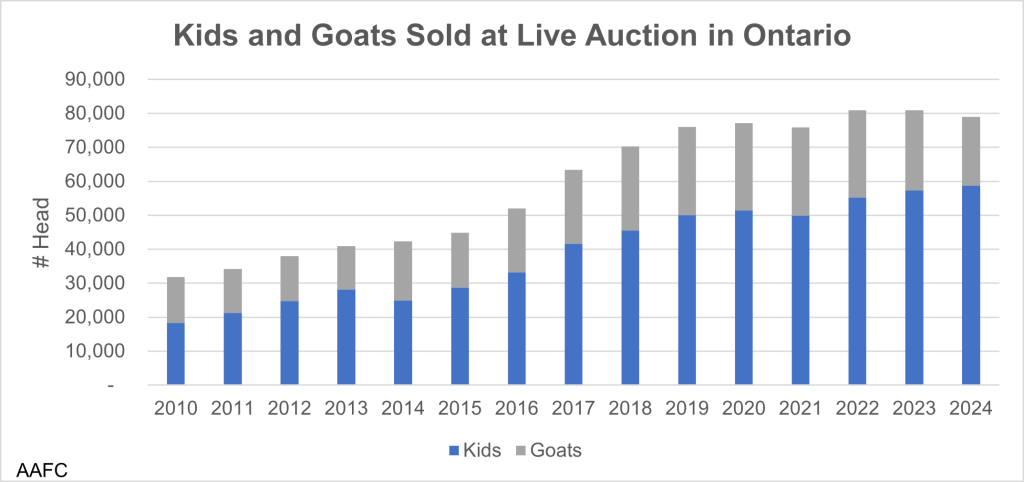
Figure 13 shows the monthly variation of kid prices over the past 6 and a half years. Kid prices fluctuate significantly throughout the year with higher prices received in the first half of the year. In 2024, monthly kid prices ranged from a low of $376.87/ 100lbs in August to a high of $504.17/100lbs in May. Average monthly prices were unusually high in the first of 2025 returning to lower price levels in July.
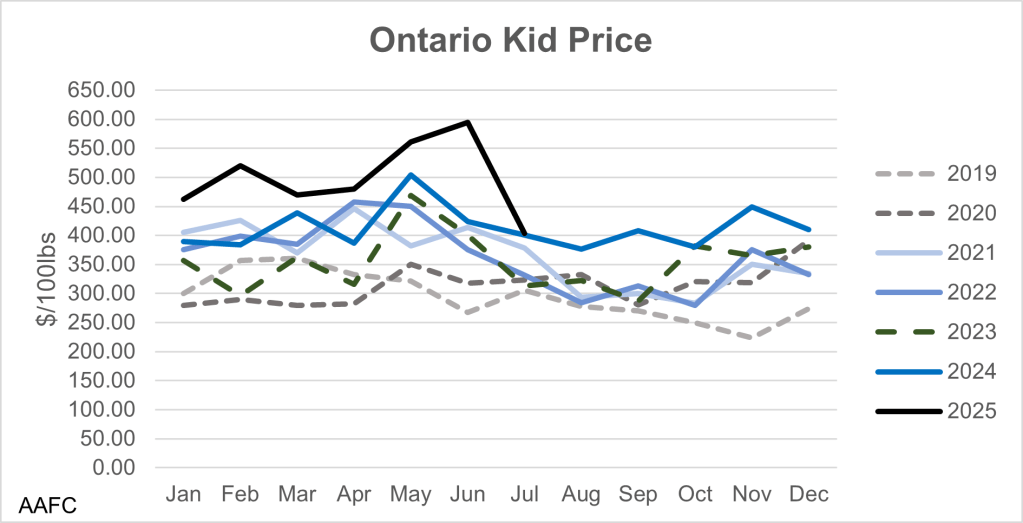
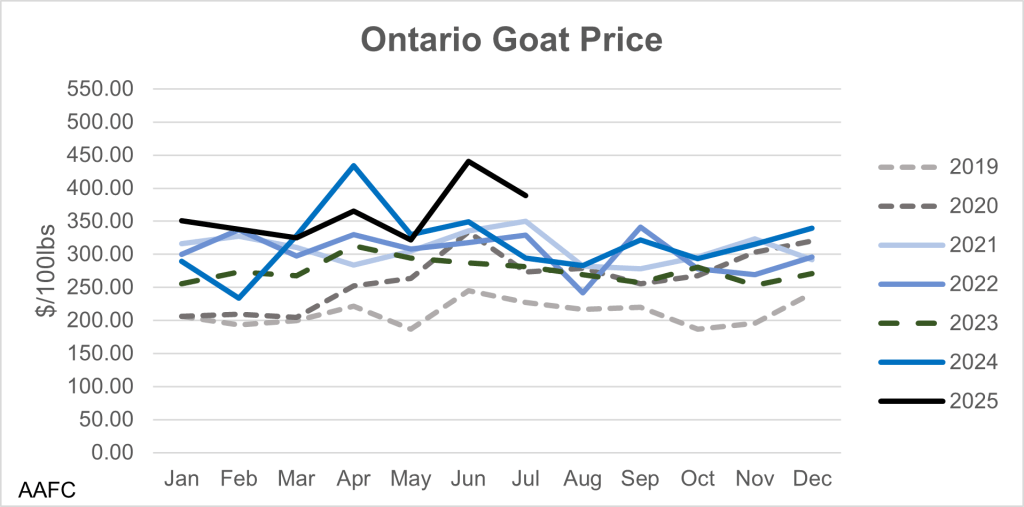
Figure 14 shows the monthly goat prices in Ontario. Goat prices in Ontario have a less distinct pattern than kid prices but do fluctuate throughout the year. In 2024, goat prices ranged from a low monthly average of $233.76/100lbs in February to a high monthly average of $434.27/100lbs in April. The average monthly price was 15.4% higher in 2024 compared to 2023. 2025 prices have been stable with an unusually high peak in June at the time of Eid ul-Adha.
Ontario Goat Meat Supply
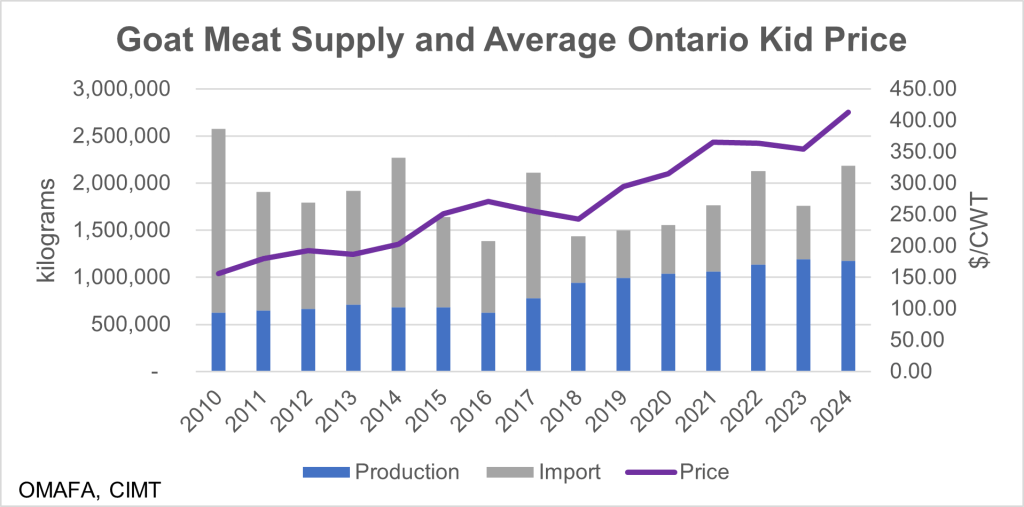
The Ontario goat meat supply is made up of provincial production and imported product. Ontario product is sold live, and weights are not available. Figure 15 estimates the Ontario supply of goat meat using an average carcass weight of 15kg. When imports are higher, more goat meat is eaten. Using these supply estimates and Ontario population estimates, estimated consumption for 2023 is 0.12kg per person and for 2024, 0.14kg per person in Ontario. In spite of variations in supply average kid price has increased steadily over the past 14 years.
Trade
Live Goat Imports and Exports
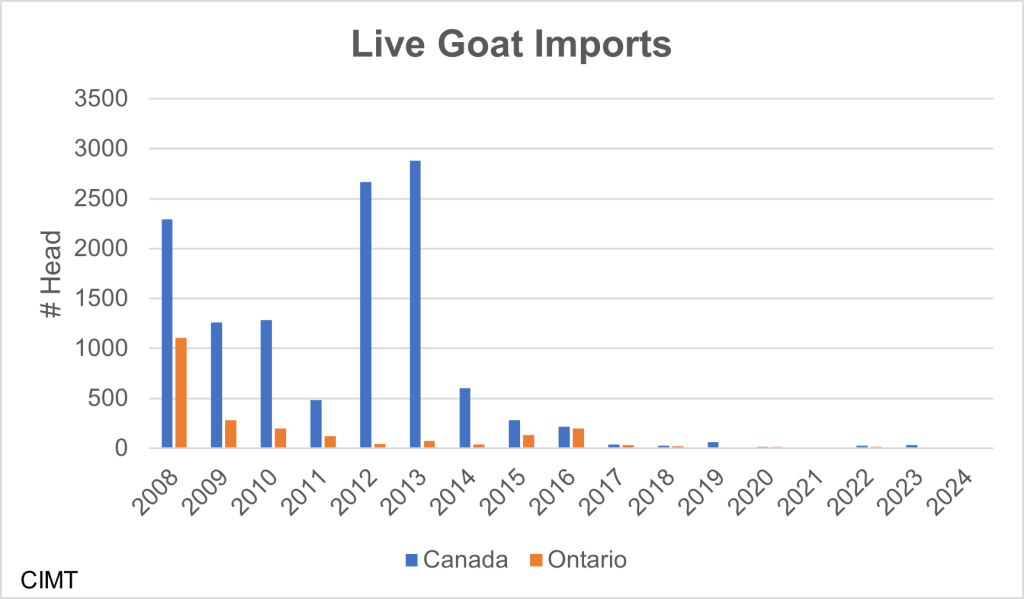
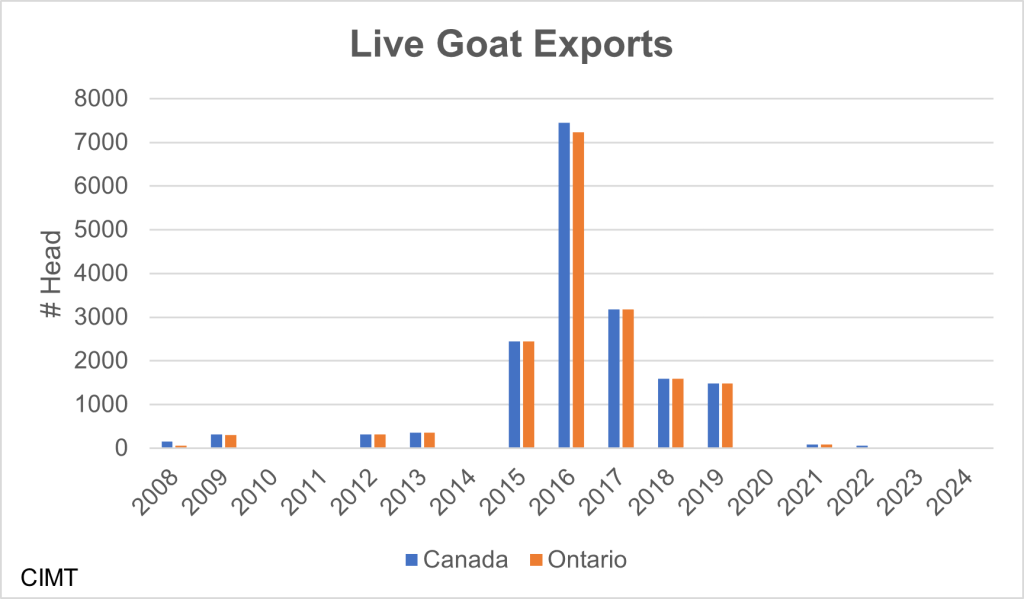
There is a limited number of live goats imported into and exported from Canada, as seen in figures 16 and 17. Since 2015, there has been less than 700 goats imported into Canada. In general, few goats have been imported into Ontario, with the most imported in 2008. Most live exports have been from Ontario. Live exports have dwindled over the last four years, with zero goats being exported in 2020, 2023 and 2024.
Goat Meat Imports and Exports
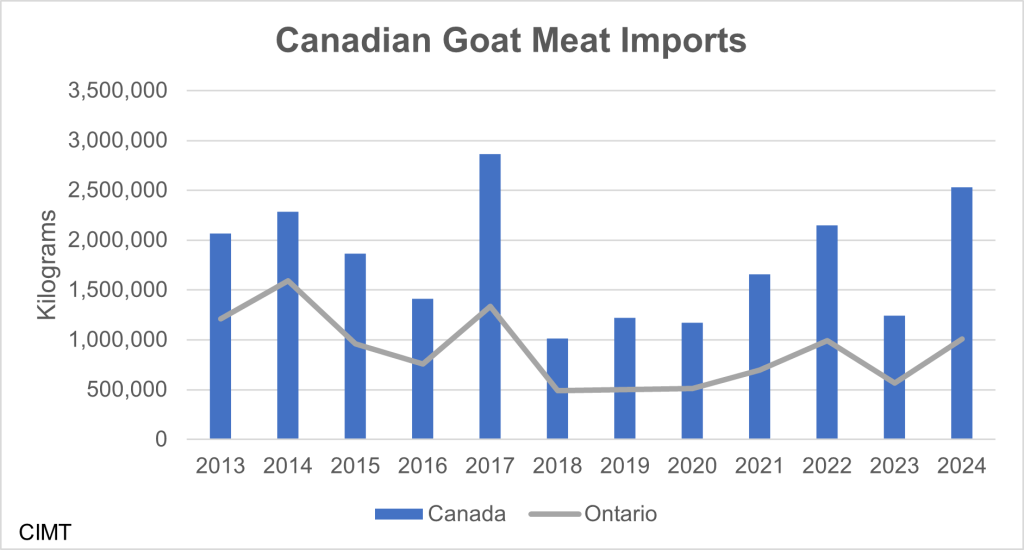
Over the past 2 decades, Canadian goat meat imports have fluctuated year to year, with a 104% increase from 2023 to 2024. In 2024, Ontario imported 39.8% of the total goat meat imported into Canada, as seen in figure 18. The quantity imported into Ontario increased by 77.5% from 2023 to 2024.
As seen in figure 19, most goat meat imports are from Australia, along with a large quantity from New Zealand and a small quantity from the United States. In 2024, 2,245,552 kilograms were imported from Australia and 187,279 kilograms were imported from New Zealand.
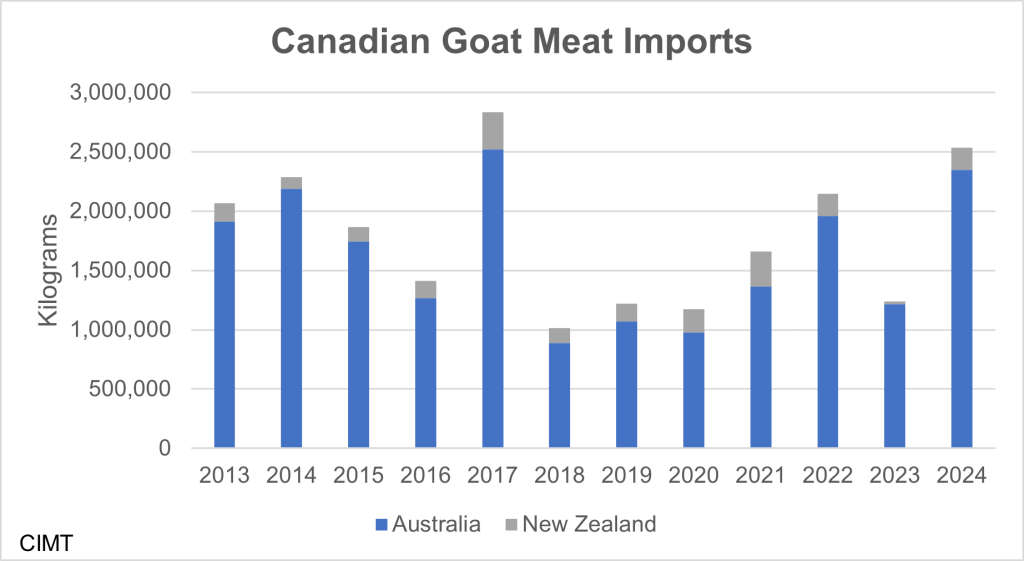
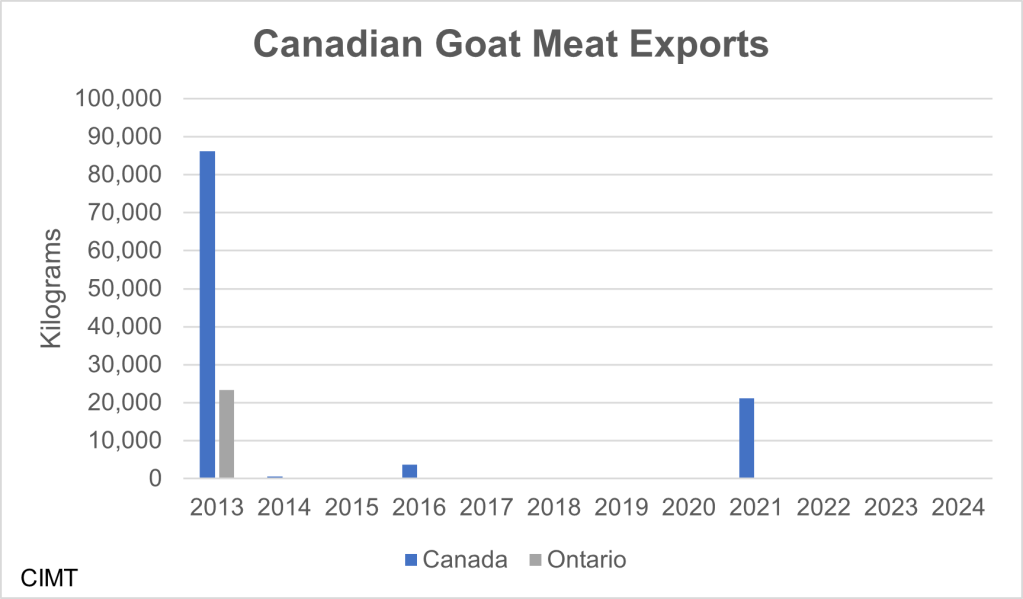
Figure 20 shows the Canadian and Ontario goat meat exports since 2013. The largest amount of goat meat was exported in 2013 to Trinidad and Tobago and Hong Kong. Since 2014, 2016 and 2021 have been the only years that goat meat has been exported. In both years, Quebec was the province exporting the meat.
Conclusion
The Ontario goat industry is a small but growing industry. The industry is primarily made up of dairy goats but there is a strong goat meat market with good prices and room for growth in Ontario.