This article was written by Kristy Blankers and Delma Kennedy.
The Canadian goat industry has continued to grow over the past decade, particularly in Ontario. The dairy industry has seen an increase in the volume of milk produced. The meat industry has had an increase in animals sold in live auctions and the number of goats slaughtered. While prices have fluctuated over the years, prices for the first half of 2024 indicate that there will be an increase in average goat meat price this year.
Inventory
Goat inventory data is only collected through the Canadian census. The last census was conducted in 2021. With 58% of the total goats in Canada, Ontario has the largest share of the goat inventory. Alberta and Quebec both have the second largest percentage of goats at 13%. Figure 1 shows the percentage of goats by province in 2021.
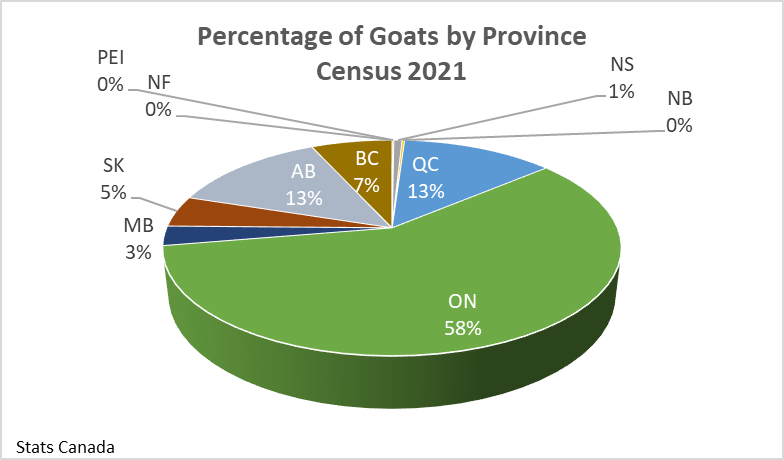
Figure 1. Percentage of total goats in Canada in each province in 2021. Source: Statistics Canada
The number of goats in Canada has increased by 12.3% from 2011 to 2021, with the Ontario goat population growing by 27.4% over this period. Figure 2 shows the number of goats by province for the past 3 census counts. This figure illustrates that most of the Canadian growth happened in Ontario with some growth in the western provinces and a decrease in numbers in provinces east of Ontario.
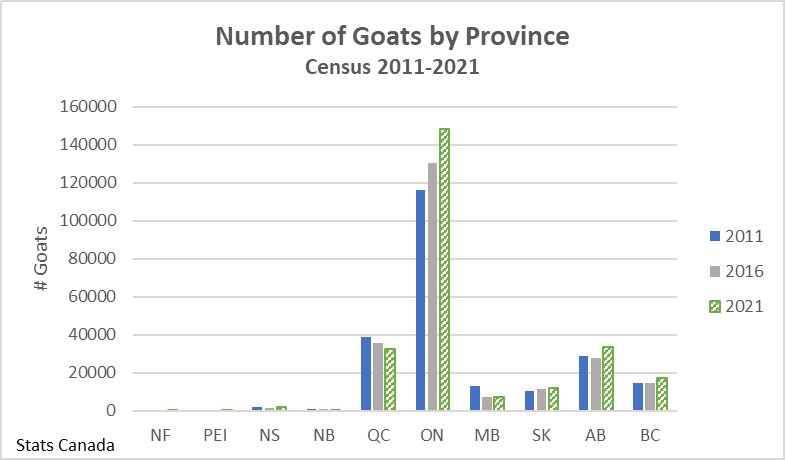
Figure 2. Number of goats in each province in 2011, 2016, and 2021. Source: Statistics Canada
The number of goat farms has decreased or remained stable in all provinces, as seen in figure 3. It is important to note that figure 3 shows all farms reporting goats, not goat farms. The decreased number of farms with goats and the increased number of goats has resulted in a Canadian average of 52.8 goats per farm in 2021 compared to 37.9 goats per farm in 2011.
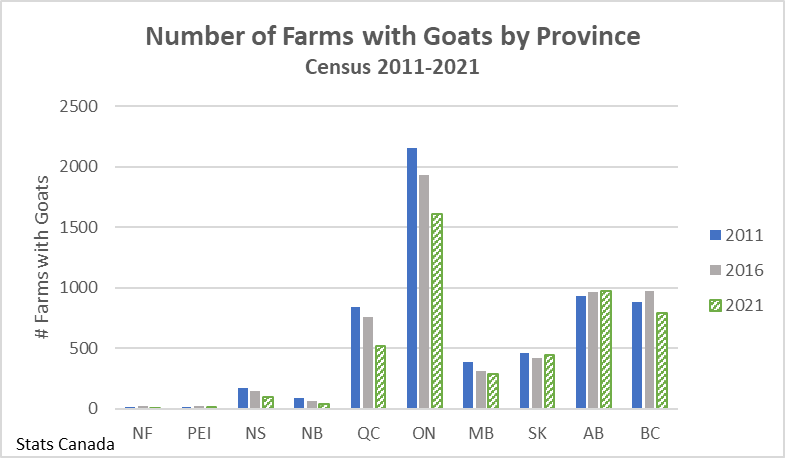
Figure 3. Number of farms with goats by province in each province in 2011, 2016, and 2021. Source: Statistics Canada
The Dairy Industry
In 2023 there were 204 licensed goat milk farms in Ontario. The number of farms peaked in 2017 at 290. Figure 4 shows that dairy goat farm numbers have been decreasing steadily since 2017 but may have started to stabilize.
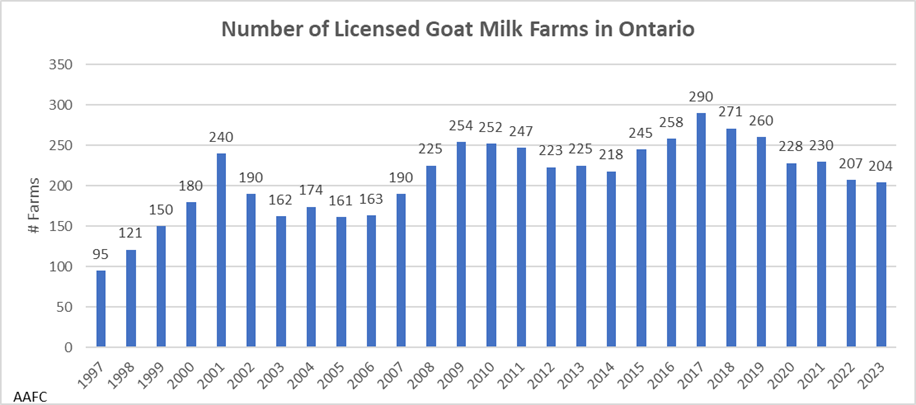
Figure 4. Number of licensed goat milk producers in Ontario from 1997 to present day. Source: Agriculture and Agri-Food Canada
Figure 5 shows the estimated milk production in Ontario and Quebec. Milk production in Ontario has remained relatively stable since 2017, while production in Quebec has been slowly decreasing. In 2022, Ontario produced 89.5% of goat milk in Canada. Ontario had a 58% increase in milk production between 2012 to 2022.

Figure 5. Estimate milk production (in millions of litres) in Ontario and Quebec. Source: Agriculture and Agri-Food Canada
The consistent milk supply since 2017 and the decrease in farm numbers since 2017 in Ontario indicate an increase in average milk production per farm. The average volume of milk produced per farm per year in Ontario has changed from 184,000 litres in 2017 to 285,000 litres in 2023, an increase of 49.8% percent.
Producer Demographics
As seen in figure 6, dairy goat operators are, on average, younger than other farm operators. In 2021, the average age of a dairy goat operator was 44.8 years of age, up from an average of 42.8 years in 2016. Whereas the average age of farm operators in Canada was 56 years of age in 2021.
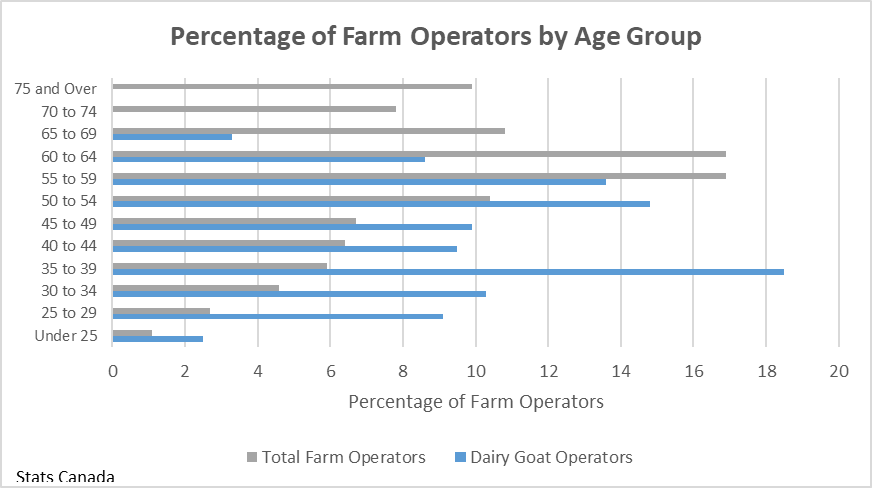
Figure 6. Percentage of dairy goat operators in each age category compared to total farm operators. Source: Statistics Canada
Cheese Imports and Exports
Figure 7 shows the imports of soft goat cheese. Soft goat cheese is the only imported cheese type identified as a goat cheese by the Canadian Dairy Information Center. Imports increased by 94.2% between 2019 and 2021, and have started to slowly decrease, with a 14.2% decrease between 2021 and 2023.
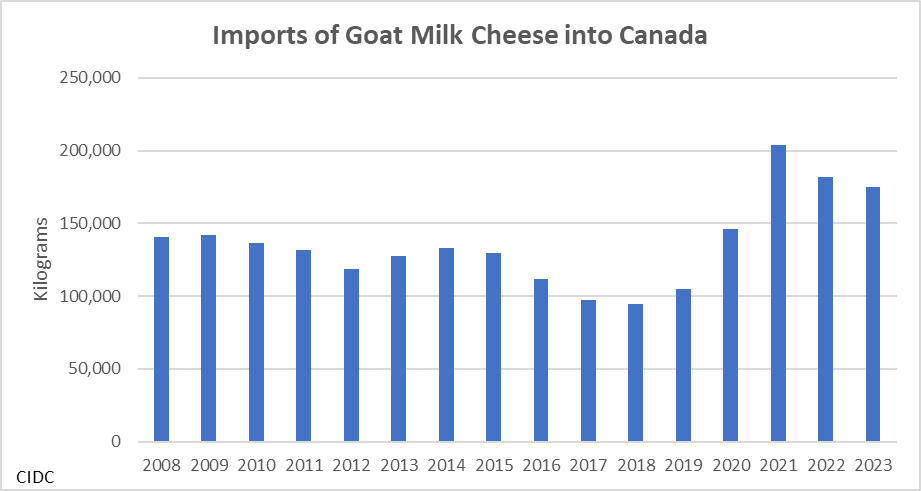
Figure 7. Imports of soft goat milk cheese (in kilograms) into Canada from 2008 to present day. Source: Canadian Dairy Information Centre
Table 1 shows the import quantities of select natural and fresh cheeses. Feta Crontonese, Ricotta, and Romano typically use a mixture of cow, sheep, and goat milk. Feta and Ricotta cheese imports have increased over the last decade, whereas Crontonese and Romano imports have decreased.
Table 1. Quantity (in kilograms) of select natural and fresh Canadian cheese varieties imported since 2014.
| Selected Natural and Fresh Canadian Cheese Varieties Import Volumes | |||||
| Year | Goat | Feta | Crontonese | Ricotta | Romano |
| 2014 | 133,185 | 900,815 | 55,933 | 6,990 | 108,466 |
| 2015 | 129,762 | 817,727 | 46,161 | 3,998 | 102,289 |
| 2016 | 111,439 | 812,570 | 15,730 | 10,080 | 74,059 |
| 2017 | 97,052 | 805,426 | 14,183 | 14,479 | 136,448 |
| 2018 | 94,284 | 1,045,590 | 68,356 | 11,398 | 191,900 |
| 2019 | 146,276 | 1,039,162 | 22,874 | 15,038 | 71,559 |
| 2020 | 105,050 | 1,128,320 | 26,714 | 16,816 | 98,236 |
| 2021 | 204,043 | 1,371,738 | 17,582 | 19,456 | 66,495 |
| 2022 | 181,766 | 1,363,985 | 19,816 | 32,016 | 67,839 |
| 2023 | 175,065 | 1,605,467 | 16,919 | 25,413 | 61,622 |
Source: Canadian Dairy Information Centre, Agriculture and Agri-Food Canada.
Gjetost cheese is the only type of goat cheese with available export information. Export quantities have been erratic, and for the past 4 years, there have been no Gjetost exports as shown in figure 8.
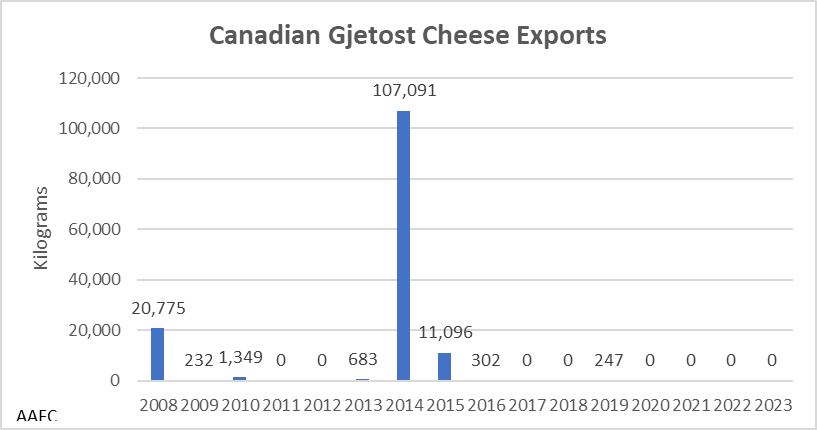
Figure 8. Quantity (in kilograms) of Canadian Gjetost Cheese exported since 2008. Source: Agriculture and Agri-Food Canada
The Meat Industry
Slaughter
Goat slaughter in Canada primarily occurs in provincially inspected plants, with less than 1% of goats being slaughtered in federal plants. Since 2016, goat slaughter numbers have been increasing, as seen in figure 9. This increase has occurred in provincial plants, whereas goat slaughter has been decreasing in federal plants.
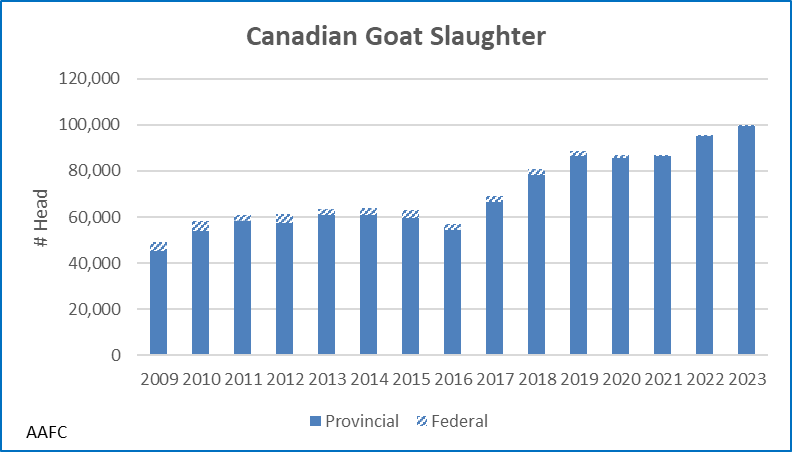
Figure 9. Number of goats slaughtered in provincially inspected and federally inspected plants. Source: Agriculture and Agri-Food Canada
Figure 10 shows the number goats slaughter in provincial plants across Canada. In 2023, 79.8% of goats slaughtered in provincial plants were in Ontario. This means that Ontario consumes approximately 79.8% of the Canadian goat meat, since provincially inspected meat cannot be moved between provinces.
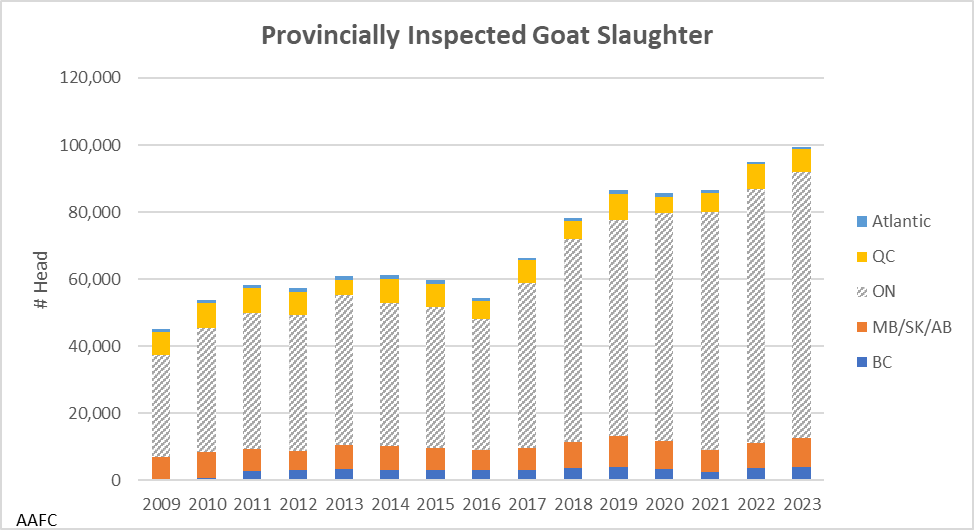
Figure 10. Number of goats slaughtered in provincially inspected plants by province. Source: Agriculture and Agri-Food Canada
Live Market Volume and Price
Figure 11 shows the number of kids and goats sold in live auctions over the past 15 years in Ontario. Since 2019 there has been a 14.6% increase in the number of kids sold and a decrease of 9.4% in the number of goats sold at live auctions in Ontario.
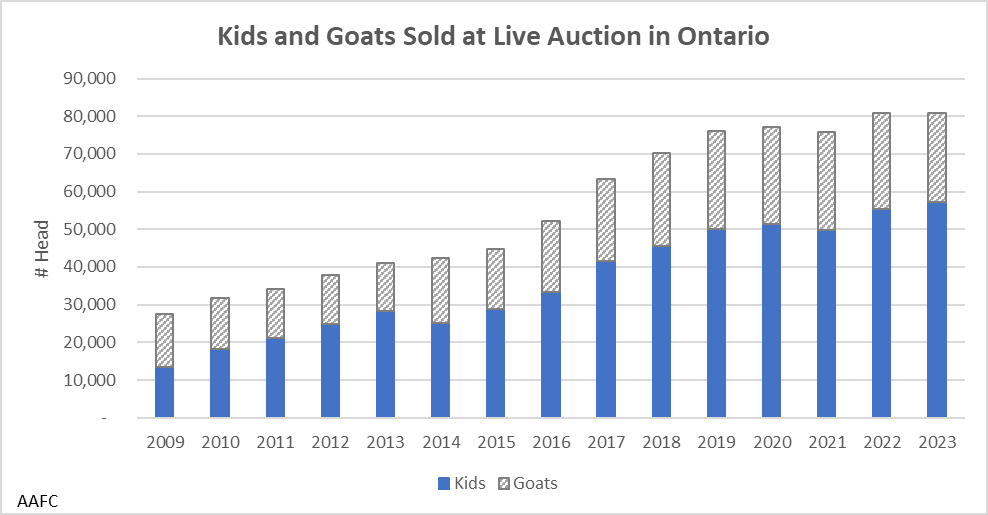
Figure 11. Number of goats and kids sold through live auctions in Ontario. Source: Agriculture and Agri-Food Canada
Figure 12 shows the monthly variation of kid prices over the past 5 and a half years. Kid prices fluctuate significantly throughout the year with higher prices received in the first half of the year. After 2020, the market reached new highs for holiday markets in 2021 and 2022. Kid prices were significantly lower than usual in the first four months of 2023 before recovering in May 2023. In 2023, monthly kid prices ranged from a low of 286.59 for September to a high of 468.86 for May. Monthly average prices in the first half of 2024 have been good and are likely to remain higher on average this year.
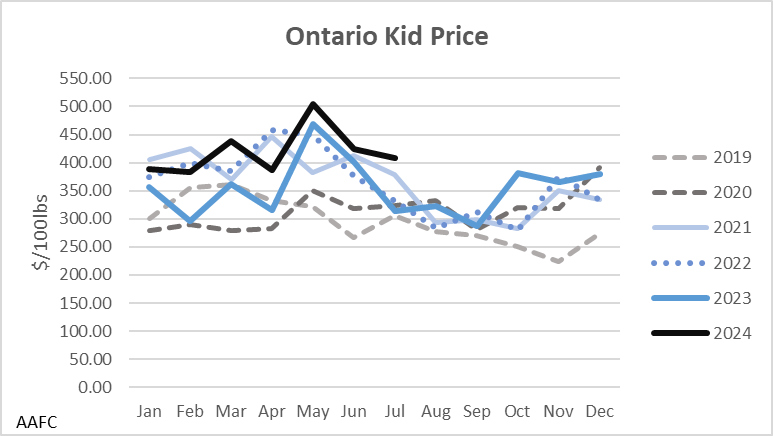
Figure 12. Monthly weighted average kid prices ($/100lbs) in Ontario. Source: Agriculture and Agri-Food Canada
Figure 13, shows the monthly goat prices in Ontario. Goat prices in Ontario have a less distinct pattern than kid prices but do fluctuate throughout the year. In 2023, goat prices ranged from a low monthly average of 252.69 in November to a high monthly average of 313.20 in April. The average monthly price was 9.4% lower in 2023 compared to 2022. 2024 prices have been volatile with a low price in February and an unusually high average price in April.

Figure 13. Monthly average weighted goat prices ($/100lbs) in Ontario. Source: Agriculture and Agri-Food Canada
Ontario Goat Meat Supply
The Ontario goat meat supply is made up of production and imported product. Ontario product is sold live, and weights are not available. Figure 14 estimates the Ontario supply of goat meat using an average carcass weight of 15kg. When imports are higher, more goat meat is eaten. Using these supply estimates and Ontario population estimates, estimated consumption for 2022 is 0.14kg per person and 0.12kg per person in 2023.
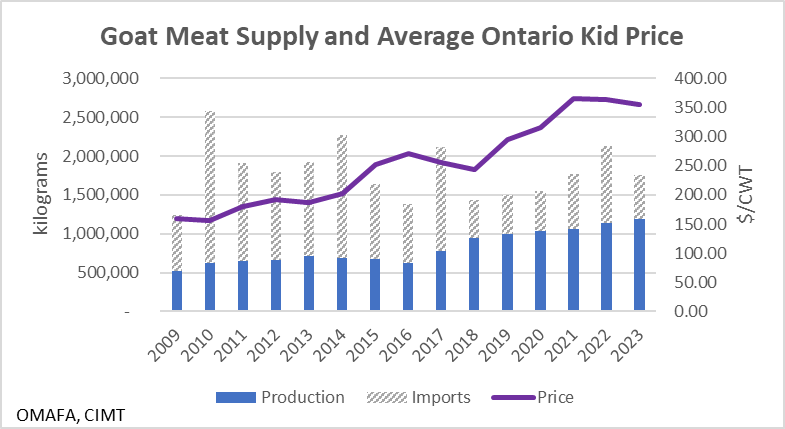
Figure 14. Estimated Ontario goat meat supply and average weighted yearly Ontario kid price by year. Source: Ontario Ministry of Agriculture, Food, and Agribusiness, Canadian International Merchandise Trade
Trade
Live Goat Imports and Exports
There is a limited number of live goats imported into and exported from Canada, as seen in figures 15 and 16. Since 2014, there has been less than 500 goats imported into Canada. In general, few goats have been imported into Ontario, with the most imported in 2008. Most live exports have been from Ontario. Live exports have dwindled over the last four years, with zero goats being exported in 2020 and 2023.
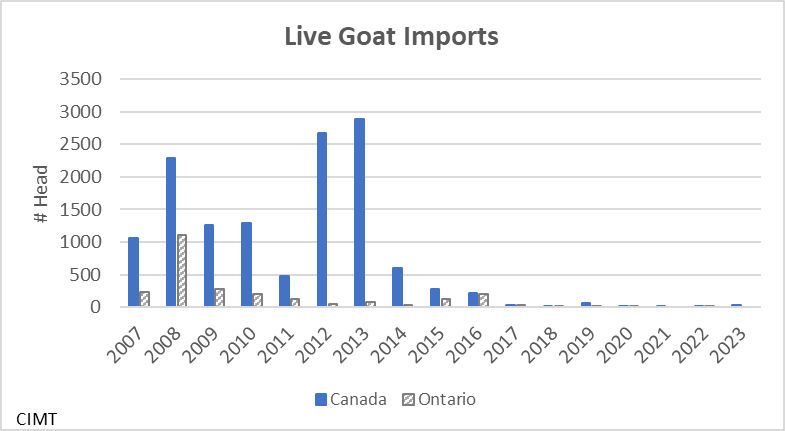
Figure 15. Number of live goats imported into Canada and Ontario from 2007 to present day. Source: Canadian International Merchandise Trade
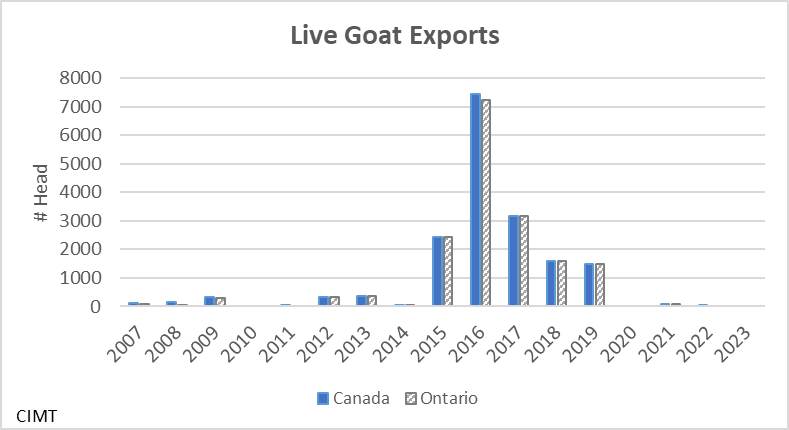
Figure 16. Number of live goats exported out of Canada and Ontario from 2007 to present day. Source: Canadian International Merchandise Trade
Goat Meat Imports and Exports
Over the past decade, Canadian goat meat imports have fluctuated year to year, with a 42.1% decrease from 2022 to 2023. In 2023, Ontario imported 45.8% of the total goat meat imported into Canada, as seen in figure 17. This Ontario quantity decreased by 42.9% from 2022 to 2023.
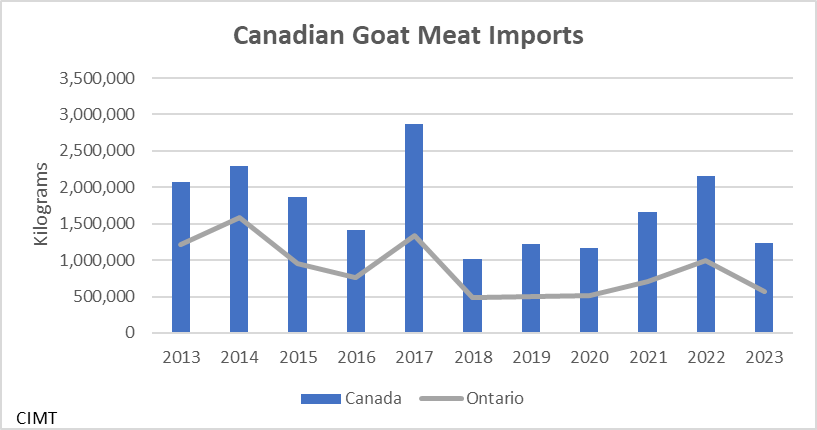
Figure 17. Quantity (in kilograms) of goat meat imported into Canada and Ontario. Source: Canadian International Merchandise Trade
As seen in figure 18, the majority of goat meat imports are from Australia. A significant volume has been imported from New Zealand with a small quantity imported from the United States, Ireland, and Nigeria over the past 2 years.
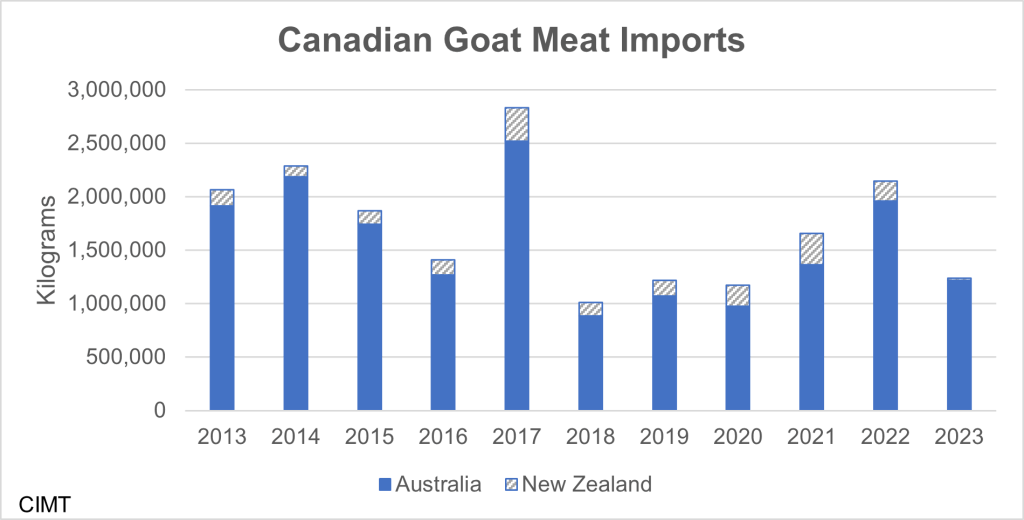
Figure 18. Quantity (in kilograms) of meat imported into Canada from Australia and New Zealand. Source: Canadian International Merchandise Trade
Figure 19 shows the Canadian and Ontario goat meat exports since 2013. The largest amount of goat meat was exported in 2013 to Trinidad and Tobago and Hong Kong. Since 2014, 2016 and 2021 have been the only years that goat meat has been exported. In both years, Quebec was the province exporting the meat.
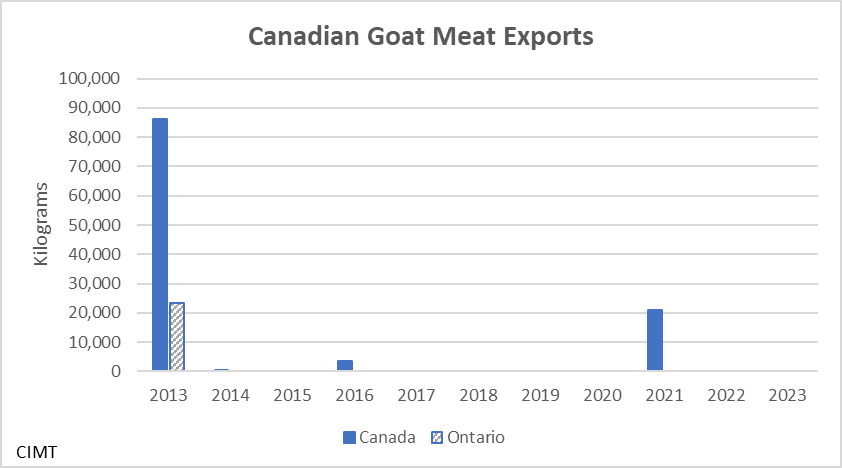
Figure 19. Quantity (in kilograms) of goat meat exported out of Canada and Ontario. Source: Canadian International Merchandise Trade
Conclusion
The goat industry in Ontario is small but is steadily increasing in size. The industry is dominated by dairy goats but there is a strong goat meat market with good prices and room for growth in Ontario.