This article was originally shown in the Spring 2020 issue of OMAFRA’s Dairy Goat Digest and authored by Jillian Craig, Small Ruminant Specialist, OMAFRA
The weighted average of monthly kid prices for 14 Ontario auction markets can be found in Figure 1. The Agriculture and Agri-Food Canada data reflects prices from 2017 to 2019 and includes a five-year average price which are reflected in dollars per hundred weight. No weight ranges are provided.

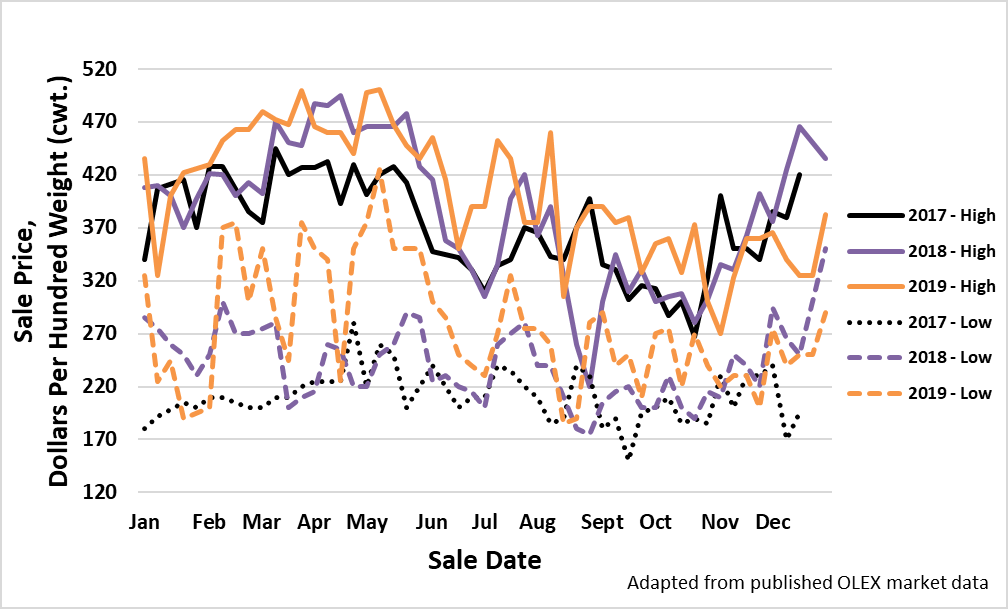
Figure 2 shows the average price per hundred weight of the total kids marketed from the Ontario Livestock Exchange (OLEX), in Waterloo.
There are no weight classes reported; this figure represents the price of all kids marketed. Volume data is included in Figure 3.

Figures 4 and 5 provide the weekly kid prices per head for the Ontario Stockyards Inc. (OSI) in Cookstown. Weight classes of kids are reported, and for the purpose of this article, two weight classes are included. Volume data can be found in Figure 6.
OSI reports three price ranges, for the purposes of this article only the ‘high’ and ‘from’ price is included:
- ‘High’ is the highest price per head
- ‘To’ is the average range in price taking out extreme highs and lows
- ‘From’ represents a low price, taking out any extreme low prices per head.
OSI had a complication with its website from the end of February to mid-April 2019 and therefore no results were reported. This is reflected in the data as a gap in both Figure 4 and 5.


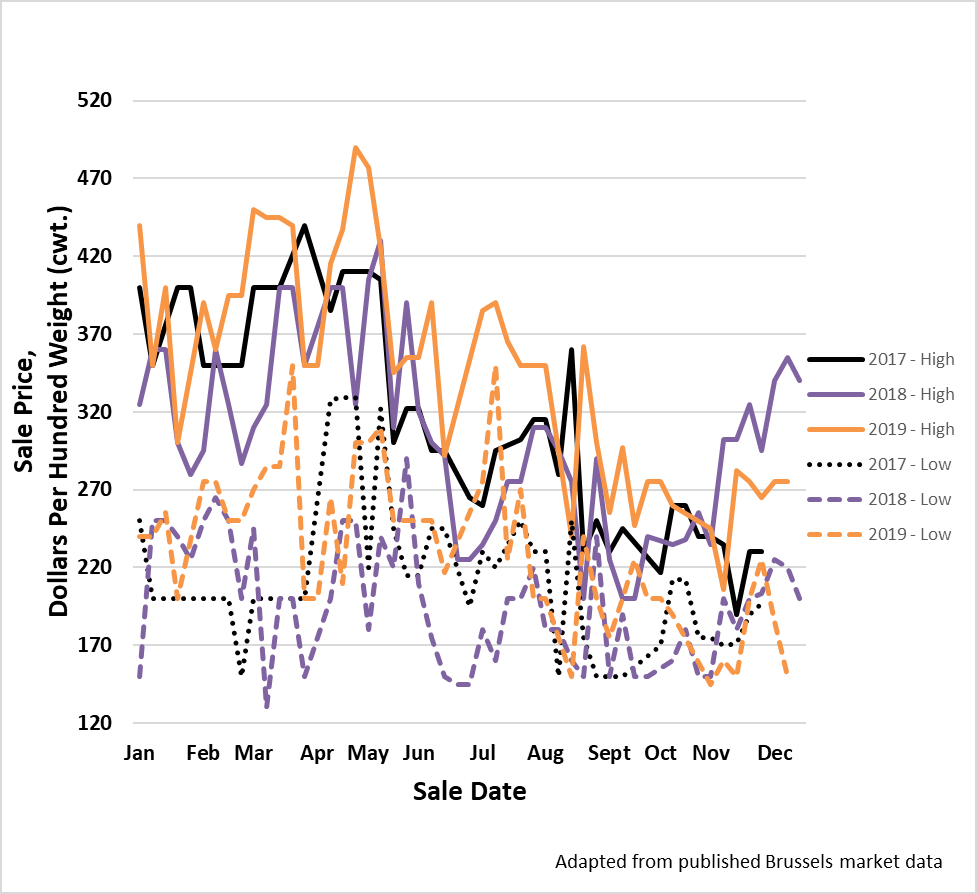
Figure 7 shows the price per hundred weight of the total kids marketed weekly from Brussels Livestock. There are no weight classes reported. In early 2017, Brussels Livestock began reporting kid prices in two categories – dairy and meat – with a high and low range in each category. For the purposes of this article, the dairy category has been included. Weekly volumes are not reported for Brussels Livestock as they do not report sheep and goats separately.